While the U.S. Federal Reserve’s primary monetary policy tool is the short-term Fed Funds Rate, market forces determine interest rates further along the yield curve. In a June 5, 2025, Barchart article on Moody’s downgrade of the U.S. sovereign credit rating, I concluded:
Moody’s reduced the U.S. sovereign credit rating because of debt concerns. Meanwhile, Republican opposition to the “big beautiful bill” in Congress and the Senate comes from members who believe increasing the debt is a tragic mistake. JP Morgan Chase’s Jamie Dimon told markets to expect a crack in the U.S. bond market, as he expects higher rates and lower bonds on the horizon.
Join 200K+ Subscribers: Find out why the midday Barchart Brief newsletter is a must-read for thousands daily.
The bond market is a real-time barometer of the U.S. credit rating. Time and events will tell if the long bond futures fall below the 107-04 technical support, which would validate Moody’s credit downgrade and Jamie Dimon’s forecast.
The President’s Big Beautiful Bill passed and was signed into law, and the bond market has not “cracked” as of July 2025. The September 30-year Treasury Bond futures were trading at 112-02 on June 2, 2025, and were little changed in late July.
The sideways trading range remains intact
The U.S. 30-year Treasury Bond futures have been in a bearish trend since the Q1 2020 high.
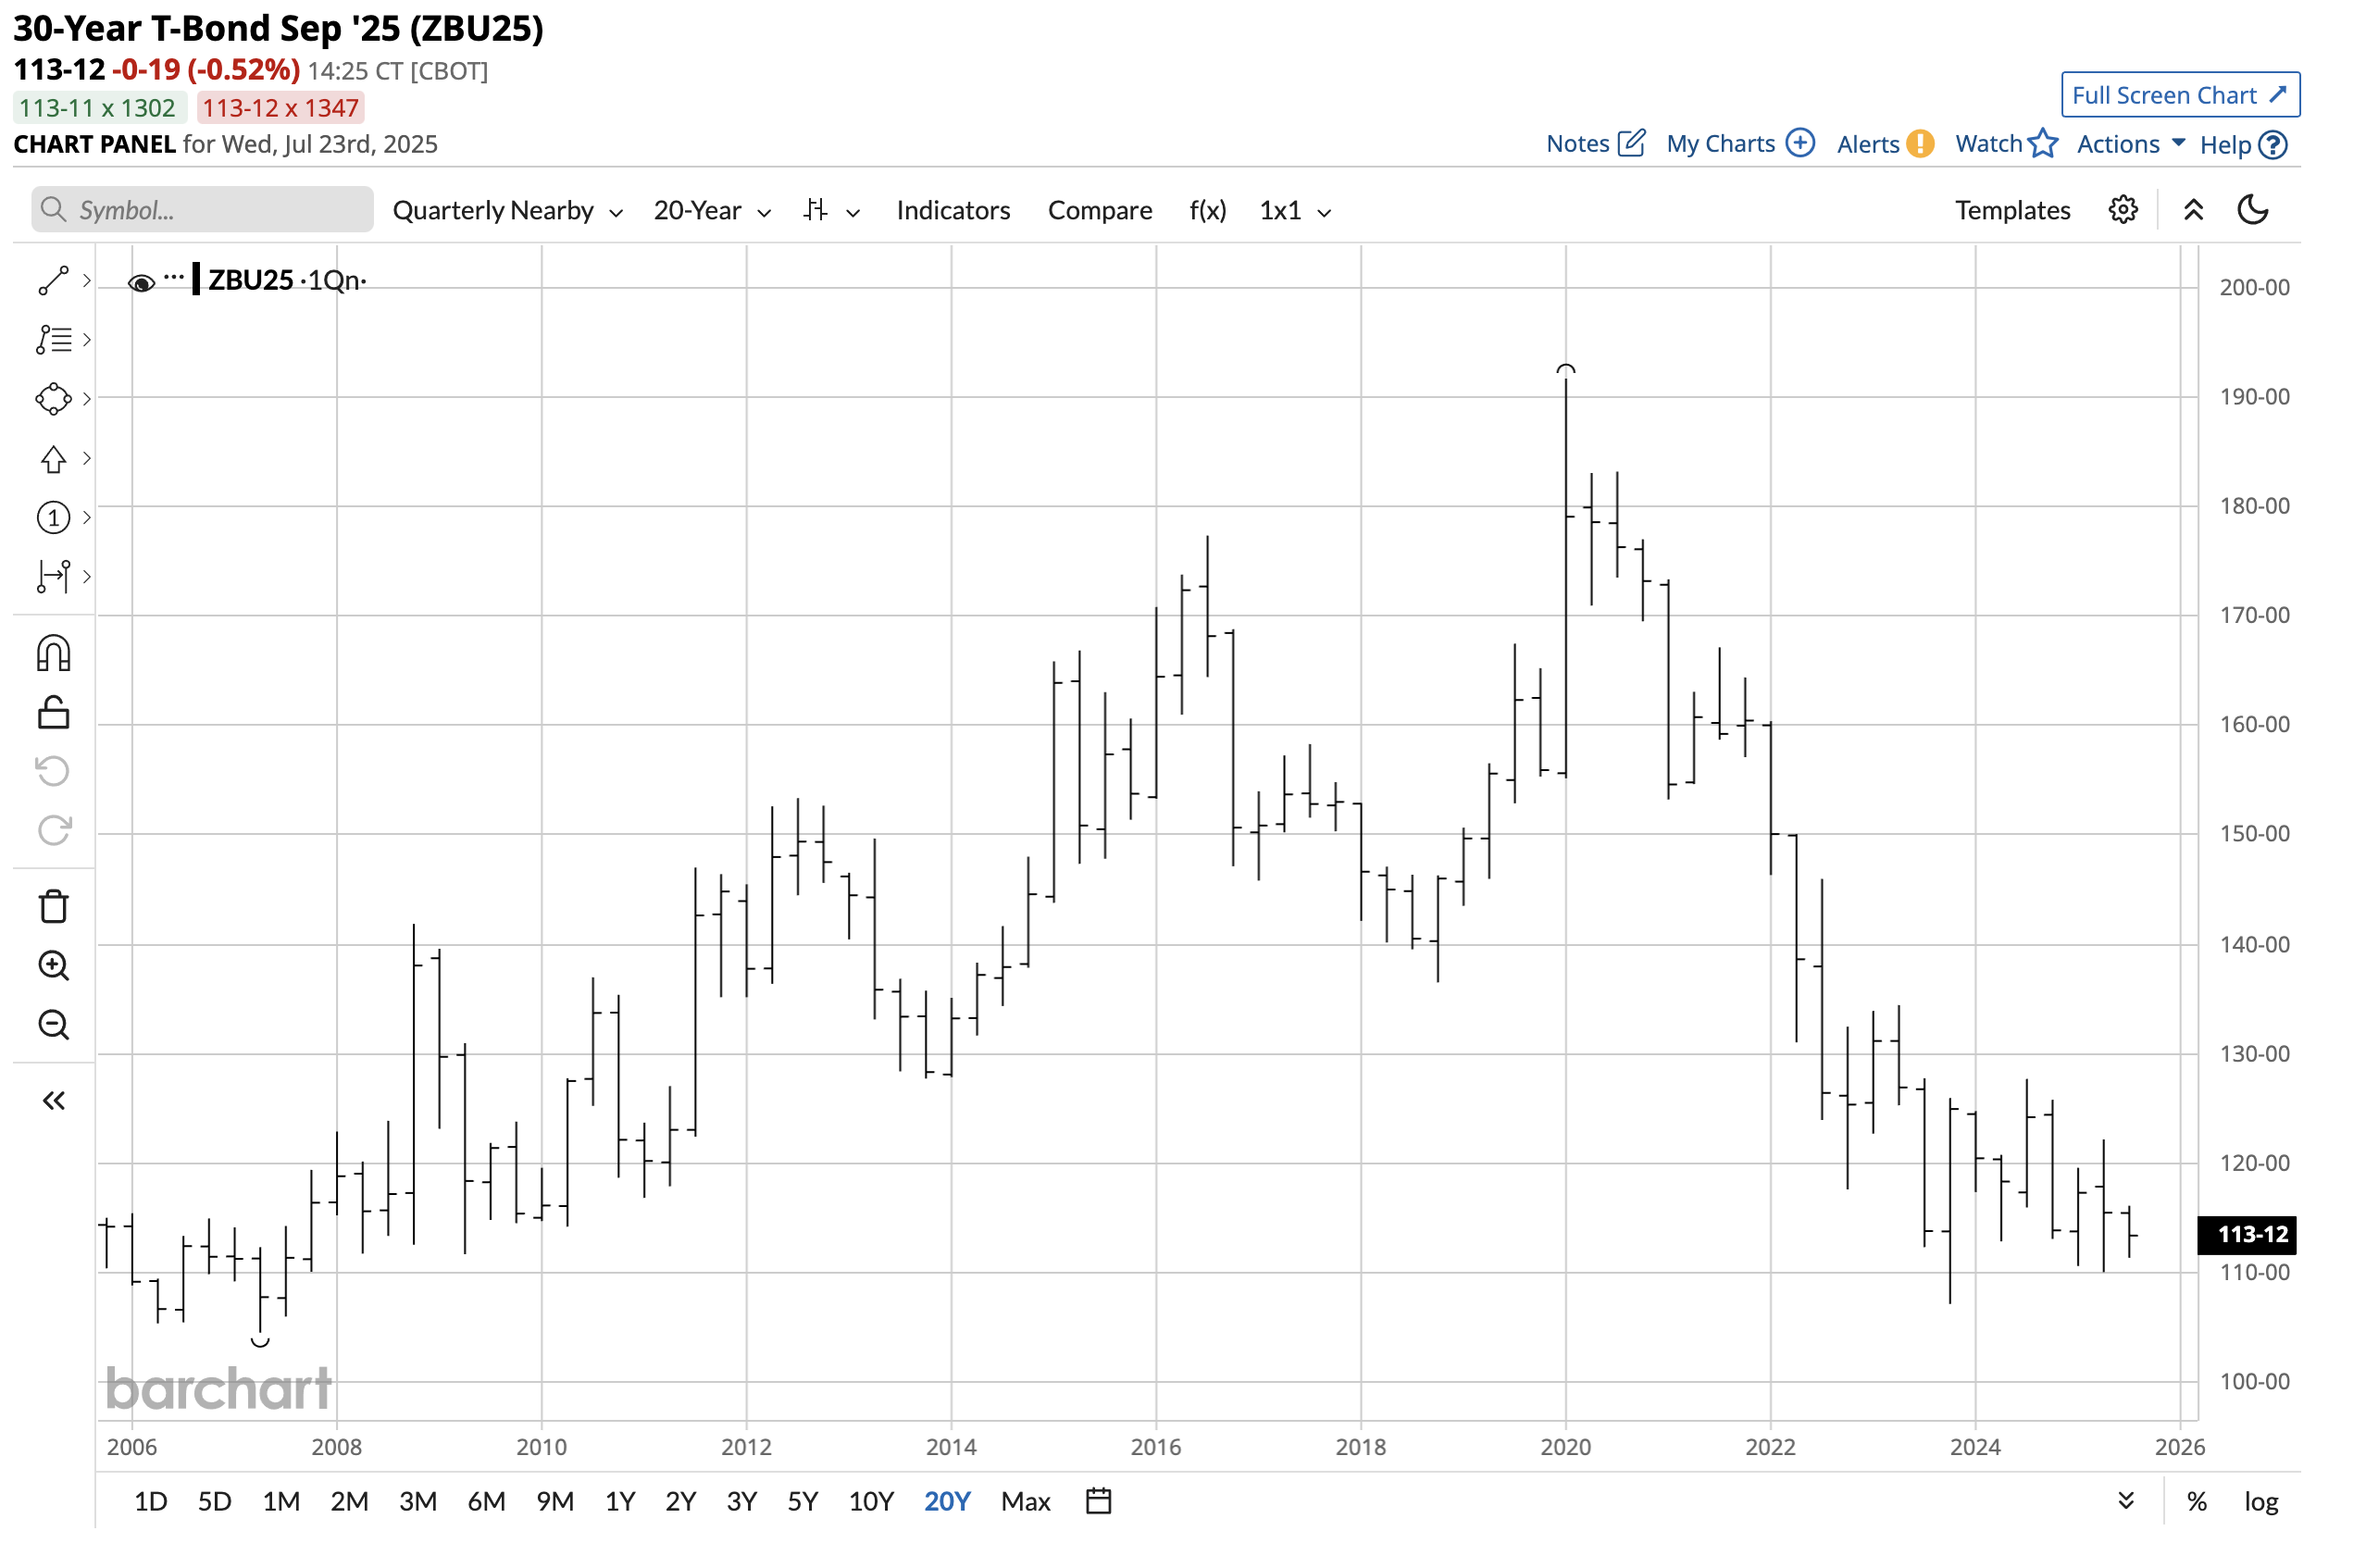
The twenty-year chart highlights the decline that took the long bond futures to a 107-04 low in Q4 2023. Since then, the bonds have been in a 110-01 to 127-22 trading range. At the 112 level in July 2025, the bonds were trading not far above the low end of the trading range.
Meanwhile, long-term technical support below the Q4 2023 low of 107-04 is at the Q2 2007 low of 104-16. Technical resistance is at the 127-22 level. While the trend remains bearish, the nearly two-year trading range has remained intact.
A change at the U.S. central bank is on the horizon
The short-term Fed Funds Rate remains at a midpoint of 4.375% unchanged in 2025. After cutting the Fed Funds Rate by 100 basis points in 2024, the central bank has left rates unchanged, citing concerns that tariffs will exacerbate inflationary pressures.
Meanwhile, President Trump has said that U.S. short-term rates should be at least 2% lower than the current level, blaming the central bank and Fed Chairman Jerome Powell for wasting billions on servicing the U.S.’s over $37 trillion debt. While the President told markets that he is not likely to fire Chairman Powell, the writing is on the wall, and the President will likely replace the current Chairman when his term expires in May 2026. The successor will undoubtedly favor lower short-term rates.
The Fed has forecast two rate cuts, totaling 50 basis points, by the end of 2025. However, the latest 50% tariff on copper and the latest June CPI data that came in higher than the previous month could prolong the pause in rate cuts from the July to the September FOMC meeting. However, the trade deal with Japan and the rising potential for an agreement with the European Union before the August 2 deadline could force the Fed’s hand to cut the short-term Fed Funds Rate, as 4.375% is too high in an environment where stagflationary pressures are diminishing.
No guarantee that lower short-term rates will lead to lower long-term rates
The Fed controls monetary policy primarily through its short-term Fed Funds Rate. The central bank is an independent body, and its mandate is full employment and stable prices. The Fed’s benchmark for stable prices is a 2% inflation target. While the economic condition has declined toward the 2% target over the past years, it has not reached the level. Meanwhile, the latest CPI data showed a 0.3% increase for June, pushing the 12-month inflation rate to 2.7%. Core CPI, excluding food and energy, rose 0.2% for the month, with the annual core rate at 2.9%. While both the CPI and core CPI rose, the increases were no surprise, as they were in line with expectations.
Rates further along the yield curve are influenced by market sentiment. The Fed cannot directly control long-term interest rates, but it does have some tools that can influence longer maturities. Quantitative tightening or easing involves selling or buying long-term government or mortgage-backed securities to influence longer-term rates. However, the government bond market is massive, and its path of least resistance, which determines long-term U.S. rates, is created by the buying or selling of debt securities. Therefore, there are no guarantees that a lower short-term Fed Funds Rate will lead to lower long-term U.S. interest rates.
The debt will rise- Does that matter?
The U.S. debt currently stands at over $37 trillion, and the administration’s economic package allows for the debt ceiling to rise by an additional $5 trillion. Moody’s, the credit rating agency, lowered its rating on U.S. sovereign debt, citing the debt level.
Many economists believe that the debt is a ticking financial time bomb, leading to slowing economic growth, higher interest rates, and a potential financial crisis. Other economists argue that the U.S. debt does not pose a threat to the U.S. economy, particularly if the debt is denominated in U.S. dollars. The U.S. can issue debt in its own currency, making default less likely and allowing the government to manage its debt obligations with flexibility. Moreover, the government can control spending and institute policies to grow its way out of debt through increased productivity and innovation, resulting in rising tax revenues. The administration argues that tariffs will offset some of the rising debt levels.
The bottom line is that if investors have confidence in the U.S. government’s ability to repay its debt, the economy will retain stability. There are compelling arguments on both sides about whether the debt level matters. Clearly, lower debt levels are preferable.
The TLT ETF tracks long-term U.S. interest rates
The most liquid ETF product tracking long-term U.S. interest rates is the iShares 20+ Year Treasury Bond ETF (TLT). At around $86 per share, TLT had over $47.6 billion in assets under management. TLT trades an average of more than 37 million shares daily and charges a 0.15% management fee.
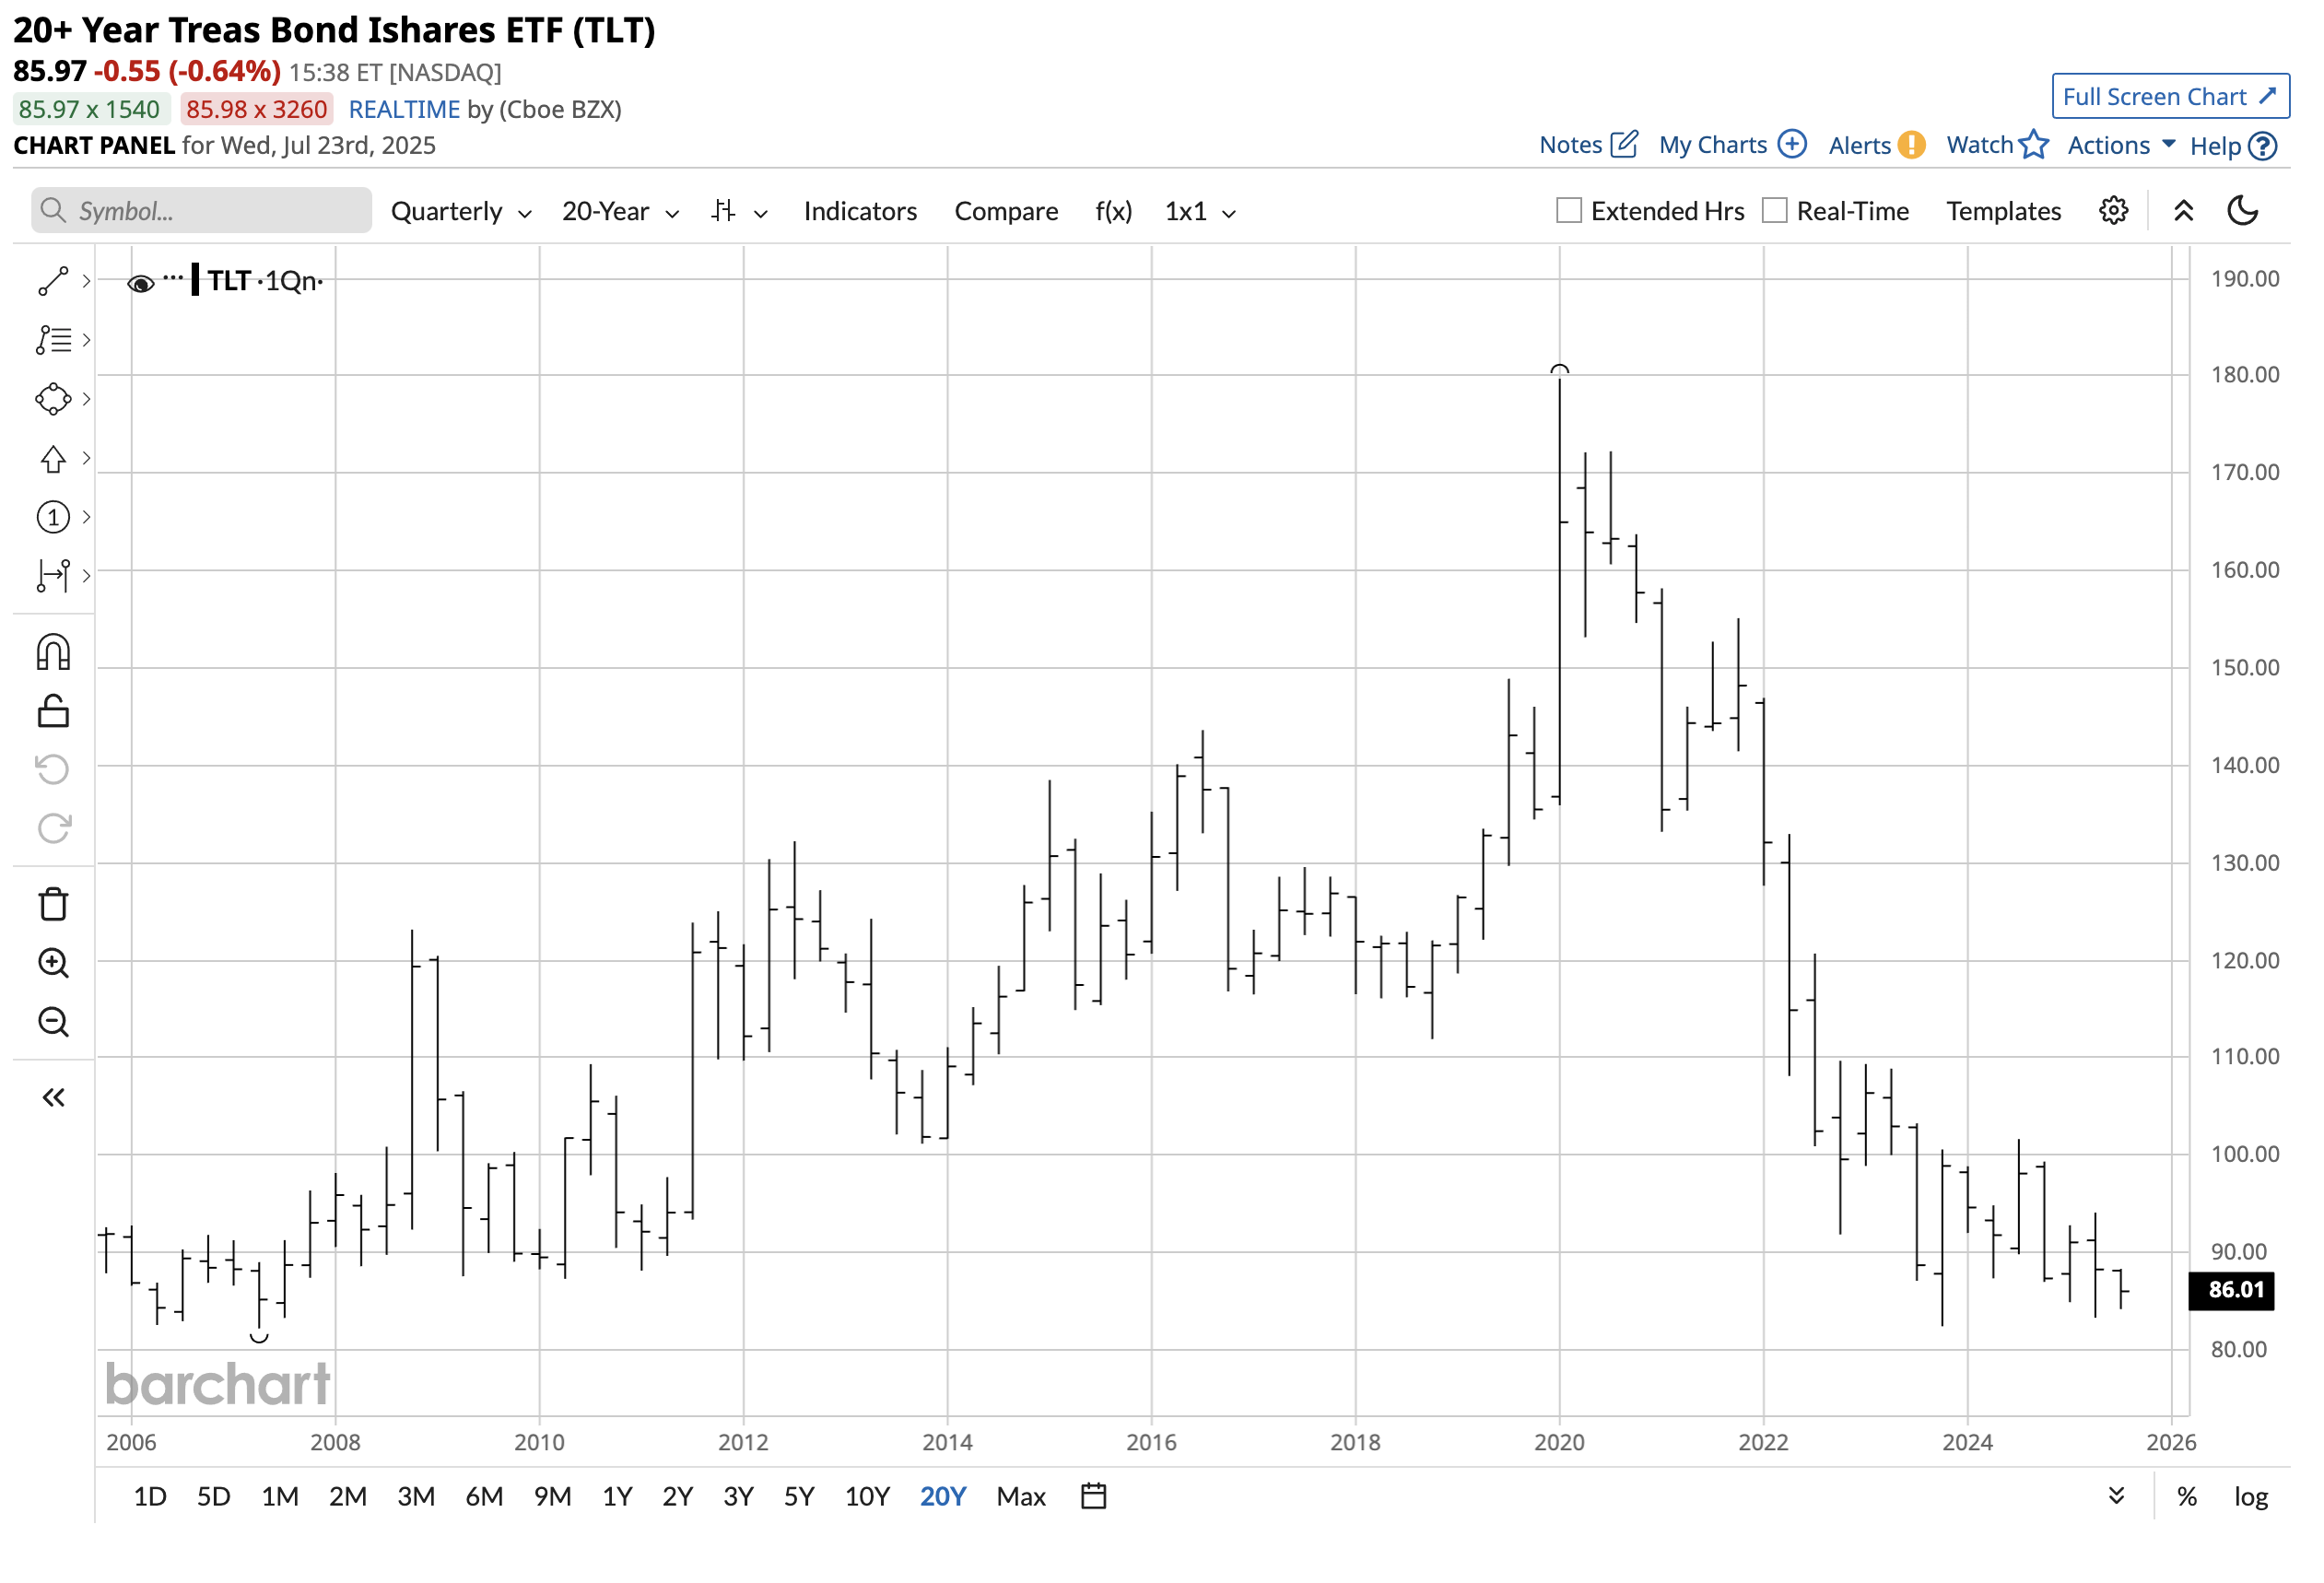
The quarterly chart shows the TLT’s performance over the past twenty years, falling from the 2020 high to the Q4 2023 low and trading in a $83.30 to $101.64 range since early 2024. TLT is a highly liquid ETF that does an excellent job tracking price action in the U.S. long bond futures.
The range since the beginning of 2024 highlights the technical support and resistance levels. If rising U.S. debt levels lead to selling in the bond market, TLT is likely to head lower. However, if the debt doesn’t matter and the U.S. can reduce spending and grow its way out of the debt through economic initiatives, the TLT will likely rally. For now, long-term interest rates and the TLT remain in a trading range, closer to the lows than the highs since early 2024, and are waiting for the next economic shoe to drop. Expect short-term rates to decline, but the path of long-term rates depends on the success of current economic initiatives.