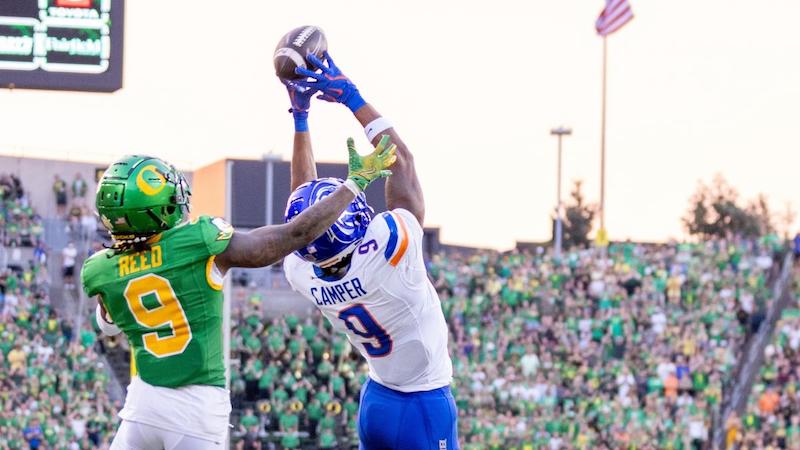
When strung together, wins over ranked opponents can signal a program’s rise to elite status.
The table below shows the win percentages, records, and performance against the spread for the region’s top programs over the last 20 seasons.
Breakdown of Records against Ranked Teams by Program from 2006-2025
| Win % | Team | Win | Loss | ATS |
|---|---|---|---|---|
| 60.8 | Oregon | 48 | 31 | +0.3 |
| 50.0 | Boise St | 14 | 14 | -0.1 |
| 46.7 | Stanford | 35 | 40 | +1.8 |
| 43.8 | Washington | 32 | 41 | +2.0 |
| 39.1 | ASU | 25 | 39 | +1.4 |
| 36.6 | BYU | 15 | 26 | +2.6 |
| 36.6 | USC | 26 | 45 | -3.4 |
| 34.9 | UCLA | 22 | 41 | +1.7 |
| 33.3 | Utah | 18 | 36 | -1.1 |
| 30.7 | Arizona | 19 | 43 | -1.1 |
| 21.7 | SDSU | 5 | 18 | +0.7 |
| 20.0 | Air Force | 4 | 16 | +3.6 |
| 19.3 | Ore St | 11 | 46 | -0.2 |
| 18.6 | WSU | 11 | 48 | +1.6 |
| 18.2 | Fresno St | 4 | 18 | -1.3 |
| 16.7 | Cal | 9 | 45 | -0.6 |
| 16.7 | Utah St | 5 | 25 | +3.7 |
| 13.0 | Nevada | 3 | 20 | -3.1 |
| 12.0 | Wyoming | 3 | 22 | -1.0 |
| 11.9 | Colorado | 7 | 52 | -3.4 |
| 9.10 | Hawai'i | 2 | 20 | -4.2 |
| 5.90 | UTEP | 1 | 16 | -1.7 |
| 4.20 | New Mexico | 1 | 23 | -4.6 |
| 4.00 | SJSU | 1 | 24 | +0.7 |
| 0.00 | UNLV | 0 | 27 | -1.5 |
| 0.00 | CSU | 0 | 19 | -0.4 |