General Motors Company (NYSE:GM) was trading lower on Friday, negating the uptrend the stock reversed into on March 9 amid overall market weakness.
The stock may now be trading in a downtrend. A downtrend occurs when a stock consistently makes a series of lower lows and lower highs on the chart.
The lower lows indicate the bears are in control, while the intermittent lower highs indicate consolidation periods. Traders can use moving averages to help identify an uptrend with descending lower timeframe moving averages (such as the eight-day or 21-day exponential moving averages), indicating the stock is in a steep shorter-term downtrend.
Descending longer-term moving averages (such as the 200-day simple moving average) indicate a long-term downtrend.
A stock often signals when the lower low is in by printing a reversal candlestick such as a doji, bullish engulfing or hammer candlestick. Likewise, the lower high could be signaled when a doji, gravestone or dragonfly candlestick is printed. Moreover, the lower lows and lower highs often take place at resistance and support levels.
In a downtrend, the "trend is your friend" until it’s not, and in a downtrend, there are ways for both bullish and bearish traders to participate in the stock:
- Bearish traders who are already holding a position in a stock can feel confident the downtrend will continue unless the stock makes a higher high. Traders looking to take a position in a stock trading in a downtrend can usually find the safest entry on the lower high.
- Bullish traders can enter the trade on the lower low and exit on the lower high. These traders can also enter when the downtrend breaks and the stock makes a higher high, indicating a reversal into an uptrend may be in the cards.
See Also: Why Ford And GM Are Suspending Production At Two Michigan Plants Next Week
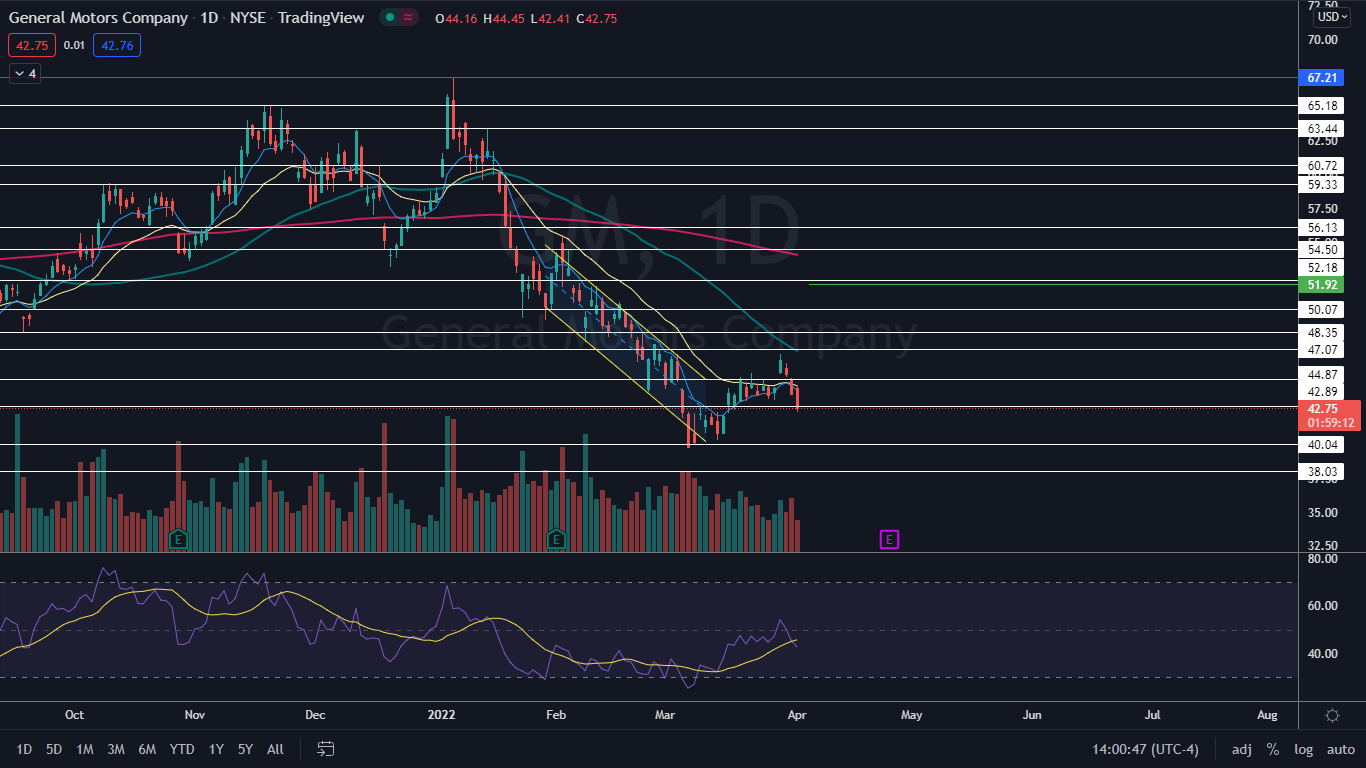
The General Motors Chart: On Friday, when General Motors fell below the most recent lower high at $43.28 on March 28, the uptrend negated and the stock may now be trading into a downtrend, although a lower high over the coming days will need to be printed for confirmation.
- General Motors attempted to regain the eight-day exponential moving average (EMA) on Friday after falling below the level on Thursday, but failed. The most likely scenario is that the eight-day EMA will now guide the stock lower.
- The stock’s relative strength index (RSI) has now crossed below the average, which further indicates a downtrend is on the horizon. As the RSI approaches the 30% level, traders can watch for a bounce to take place. The RSI is currently measuring in at about 42% and trending downward.
- Bulls will want to see big bullish volume come in and push General Motors back up above the eight-day EMA on Monday, which would indicate Friday’s price action was a bear trap.
- General Motors has resistance above at $42.89 and $44.87 and support below at $40.04 and $38.03.
Want direct analysis? Find me in the BZ Pro lounge! Click here for a free trial.
GM CEO Mary Barra. Benzinga file photo by Dustin Blitchok.