In a May 16, 2025, Barchart article on copper, I concluded:
We witnessed another in a long series of golden buying opportunities when copper prices fell to the April 7 low and held above their critical technical support level. Technical and fundamental factors favor higher copper prices, but even the most aggressive bull market trends rarely move in straight lines, and copper is no exception. Expect lots of volatility in the copper futures, forwards, and the CPER ETF. High price variance creates many trading opportunities.
Nearby COMEX copper futures were at the $4.5740 per pound level on May 16, and have moved far higher to a new record peak in July 2025. The CPER ETF was at $28.57 in mid-May and has gone along for the bullish ride. Meanwhile, LME forwards were at $9,577 per metric ton on May 15, and although they have appreciated, they have not yet reached a new record peak. Tariffs remain a critical factor for the copper market in late July 2025.
New highs in COMEX copper futures
After falling from a new all-time continuous contract high of $5.3740 per pound in March 2025 to just above the $4 technical support level after the April 2, 2025, tariff announcements excluded copper, the COMEX futures rallied back to the $5 level by the end of June 2025.
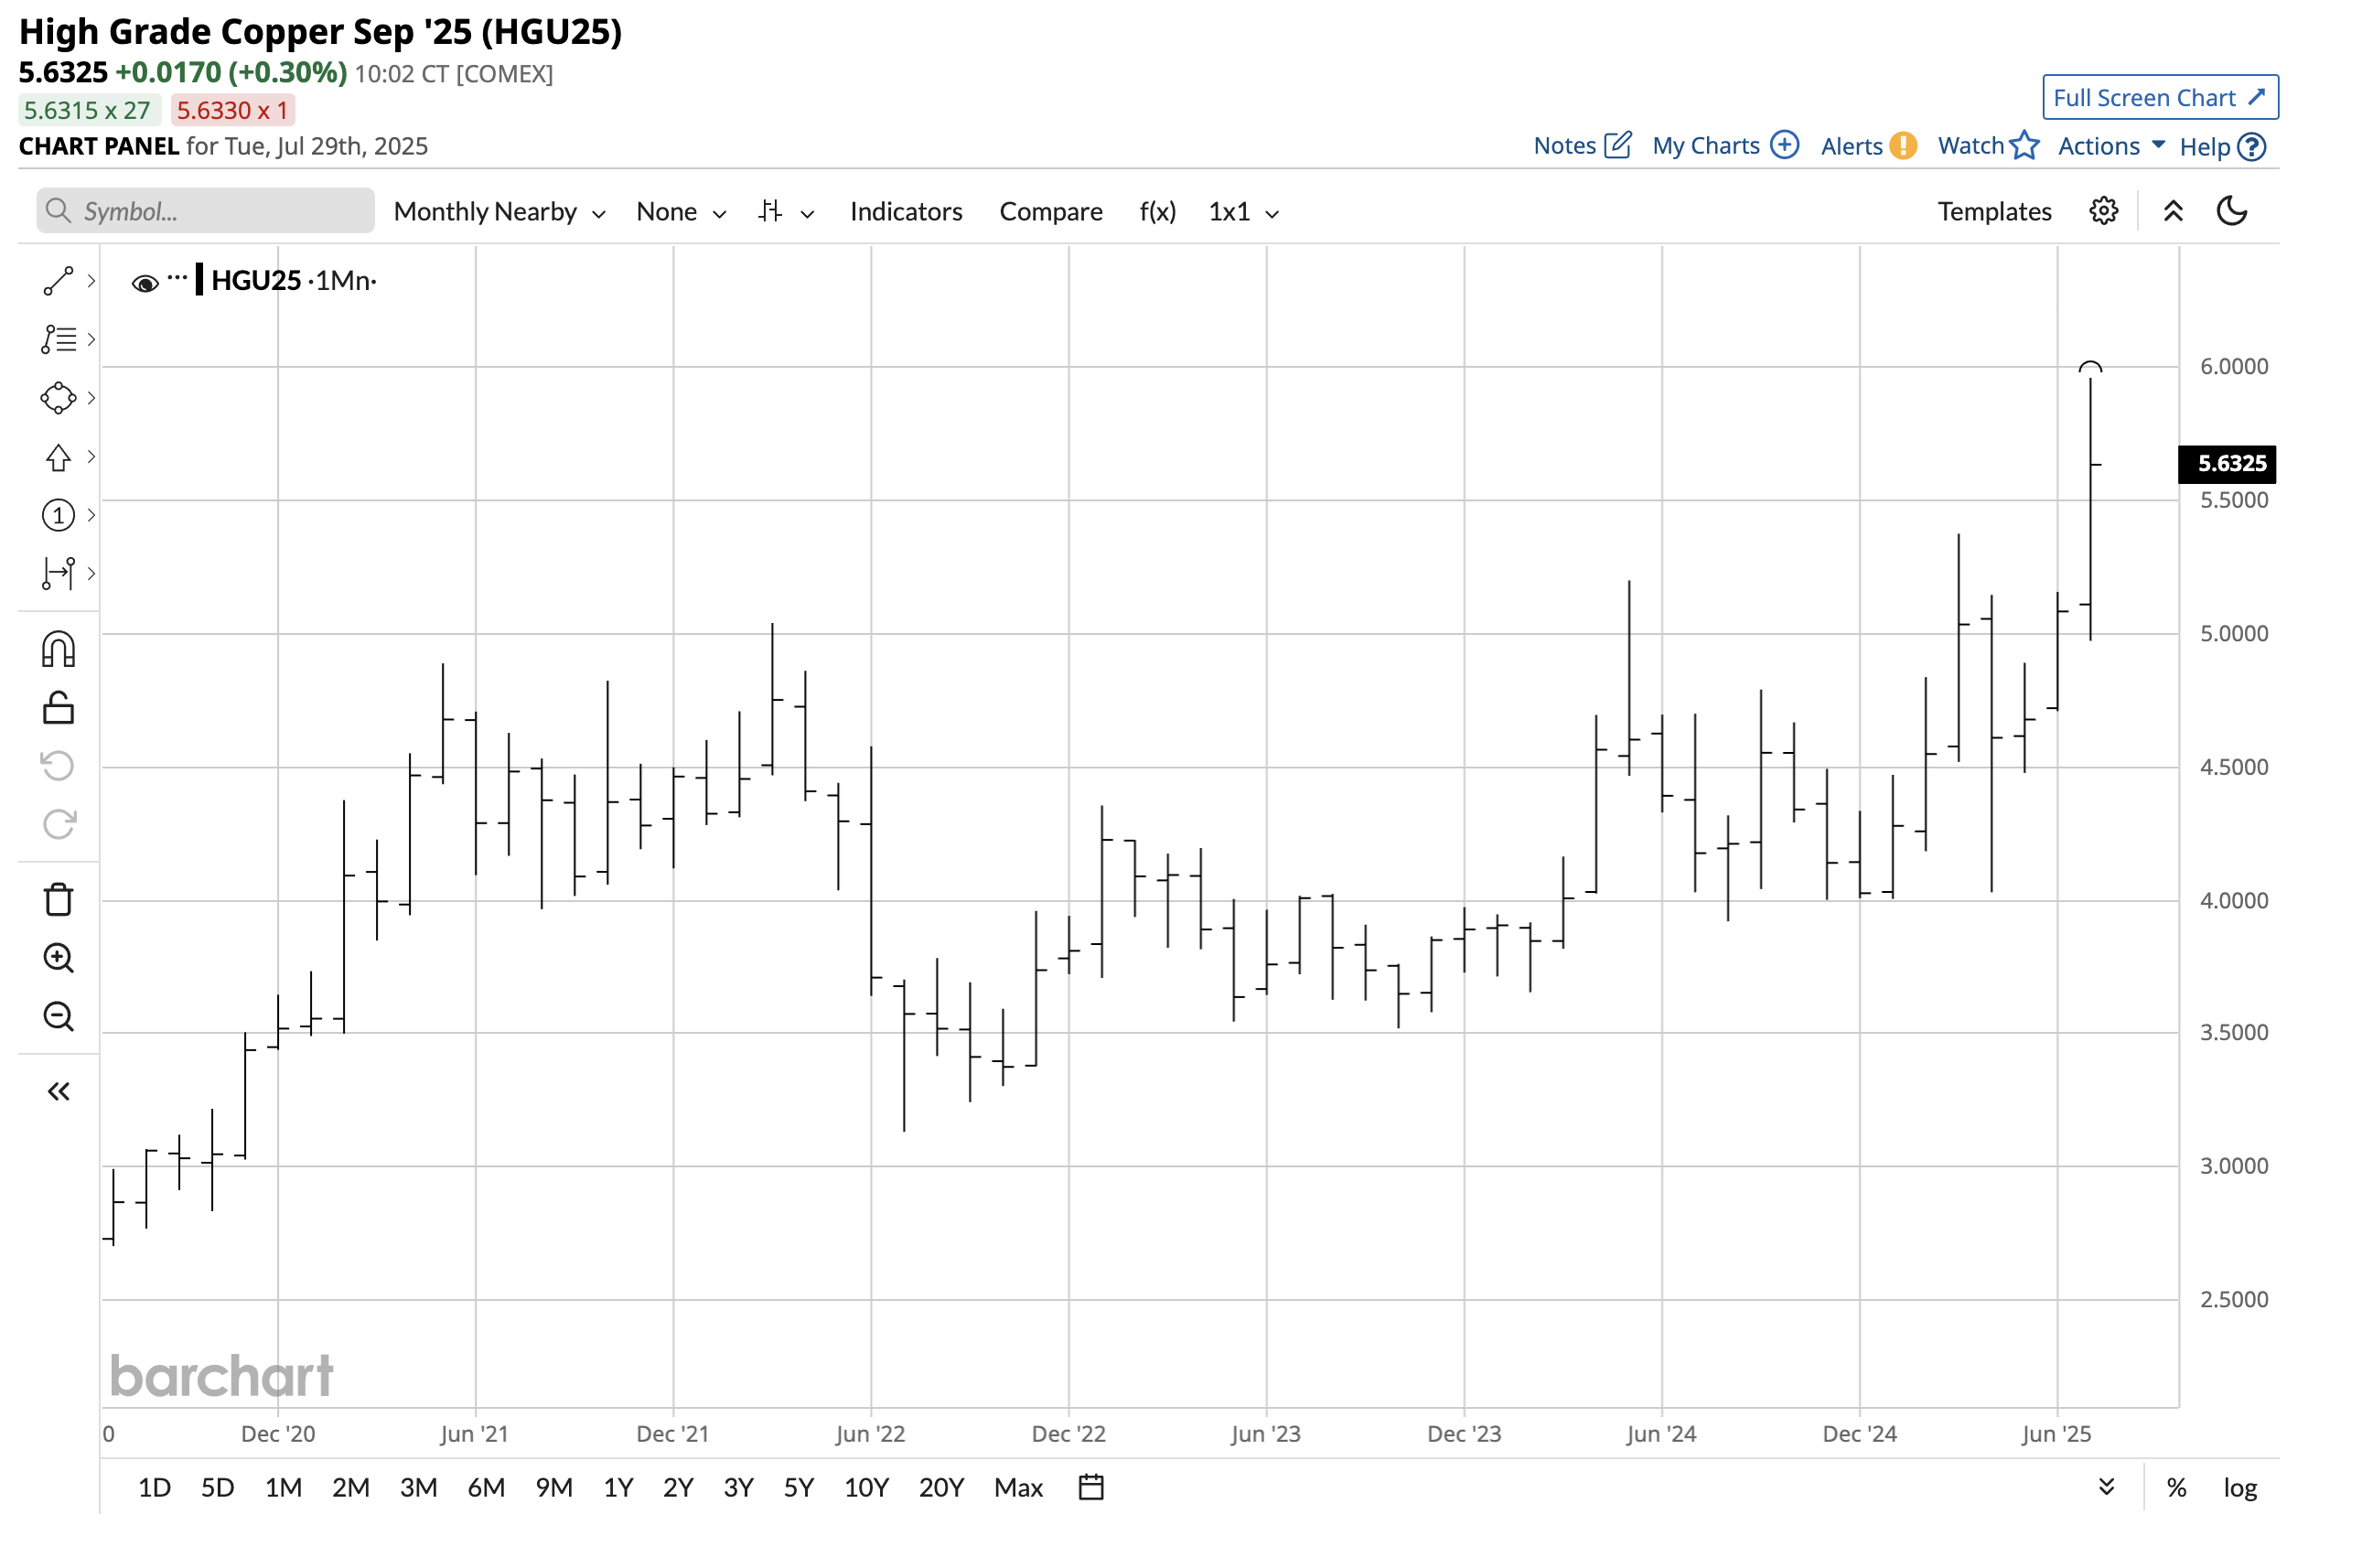
The monthly chart shows that copper futures surged to a new record high of $5.9585 in July, following President Trump’s announcement of a 50% tariff on the red nonferrous metal. At above $5.60 per pound in late July, copper remained above the previous March 2025 all-time peak.
LME copper forwards rise, but remain below the 2024 peak
The world’s most liquid copper forward market on the London Metals Exchange moved higher and lower with the COMEX futures but has not yet challenged the May 2024 all-time high.
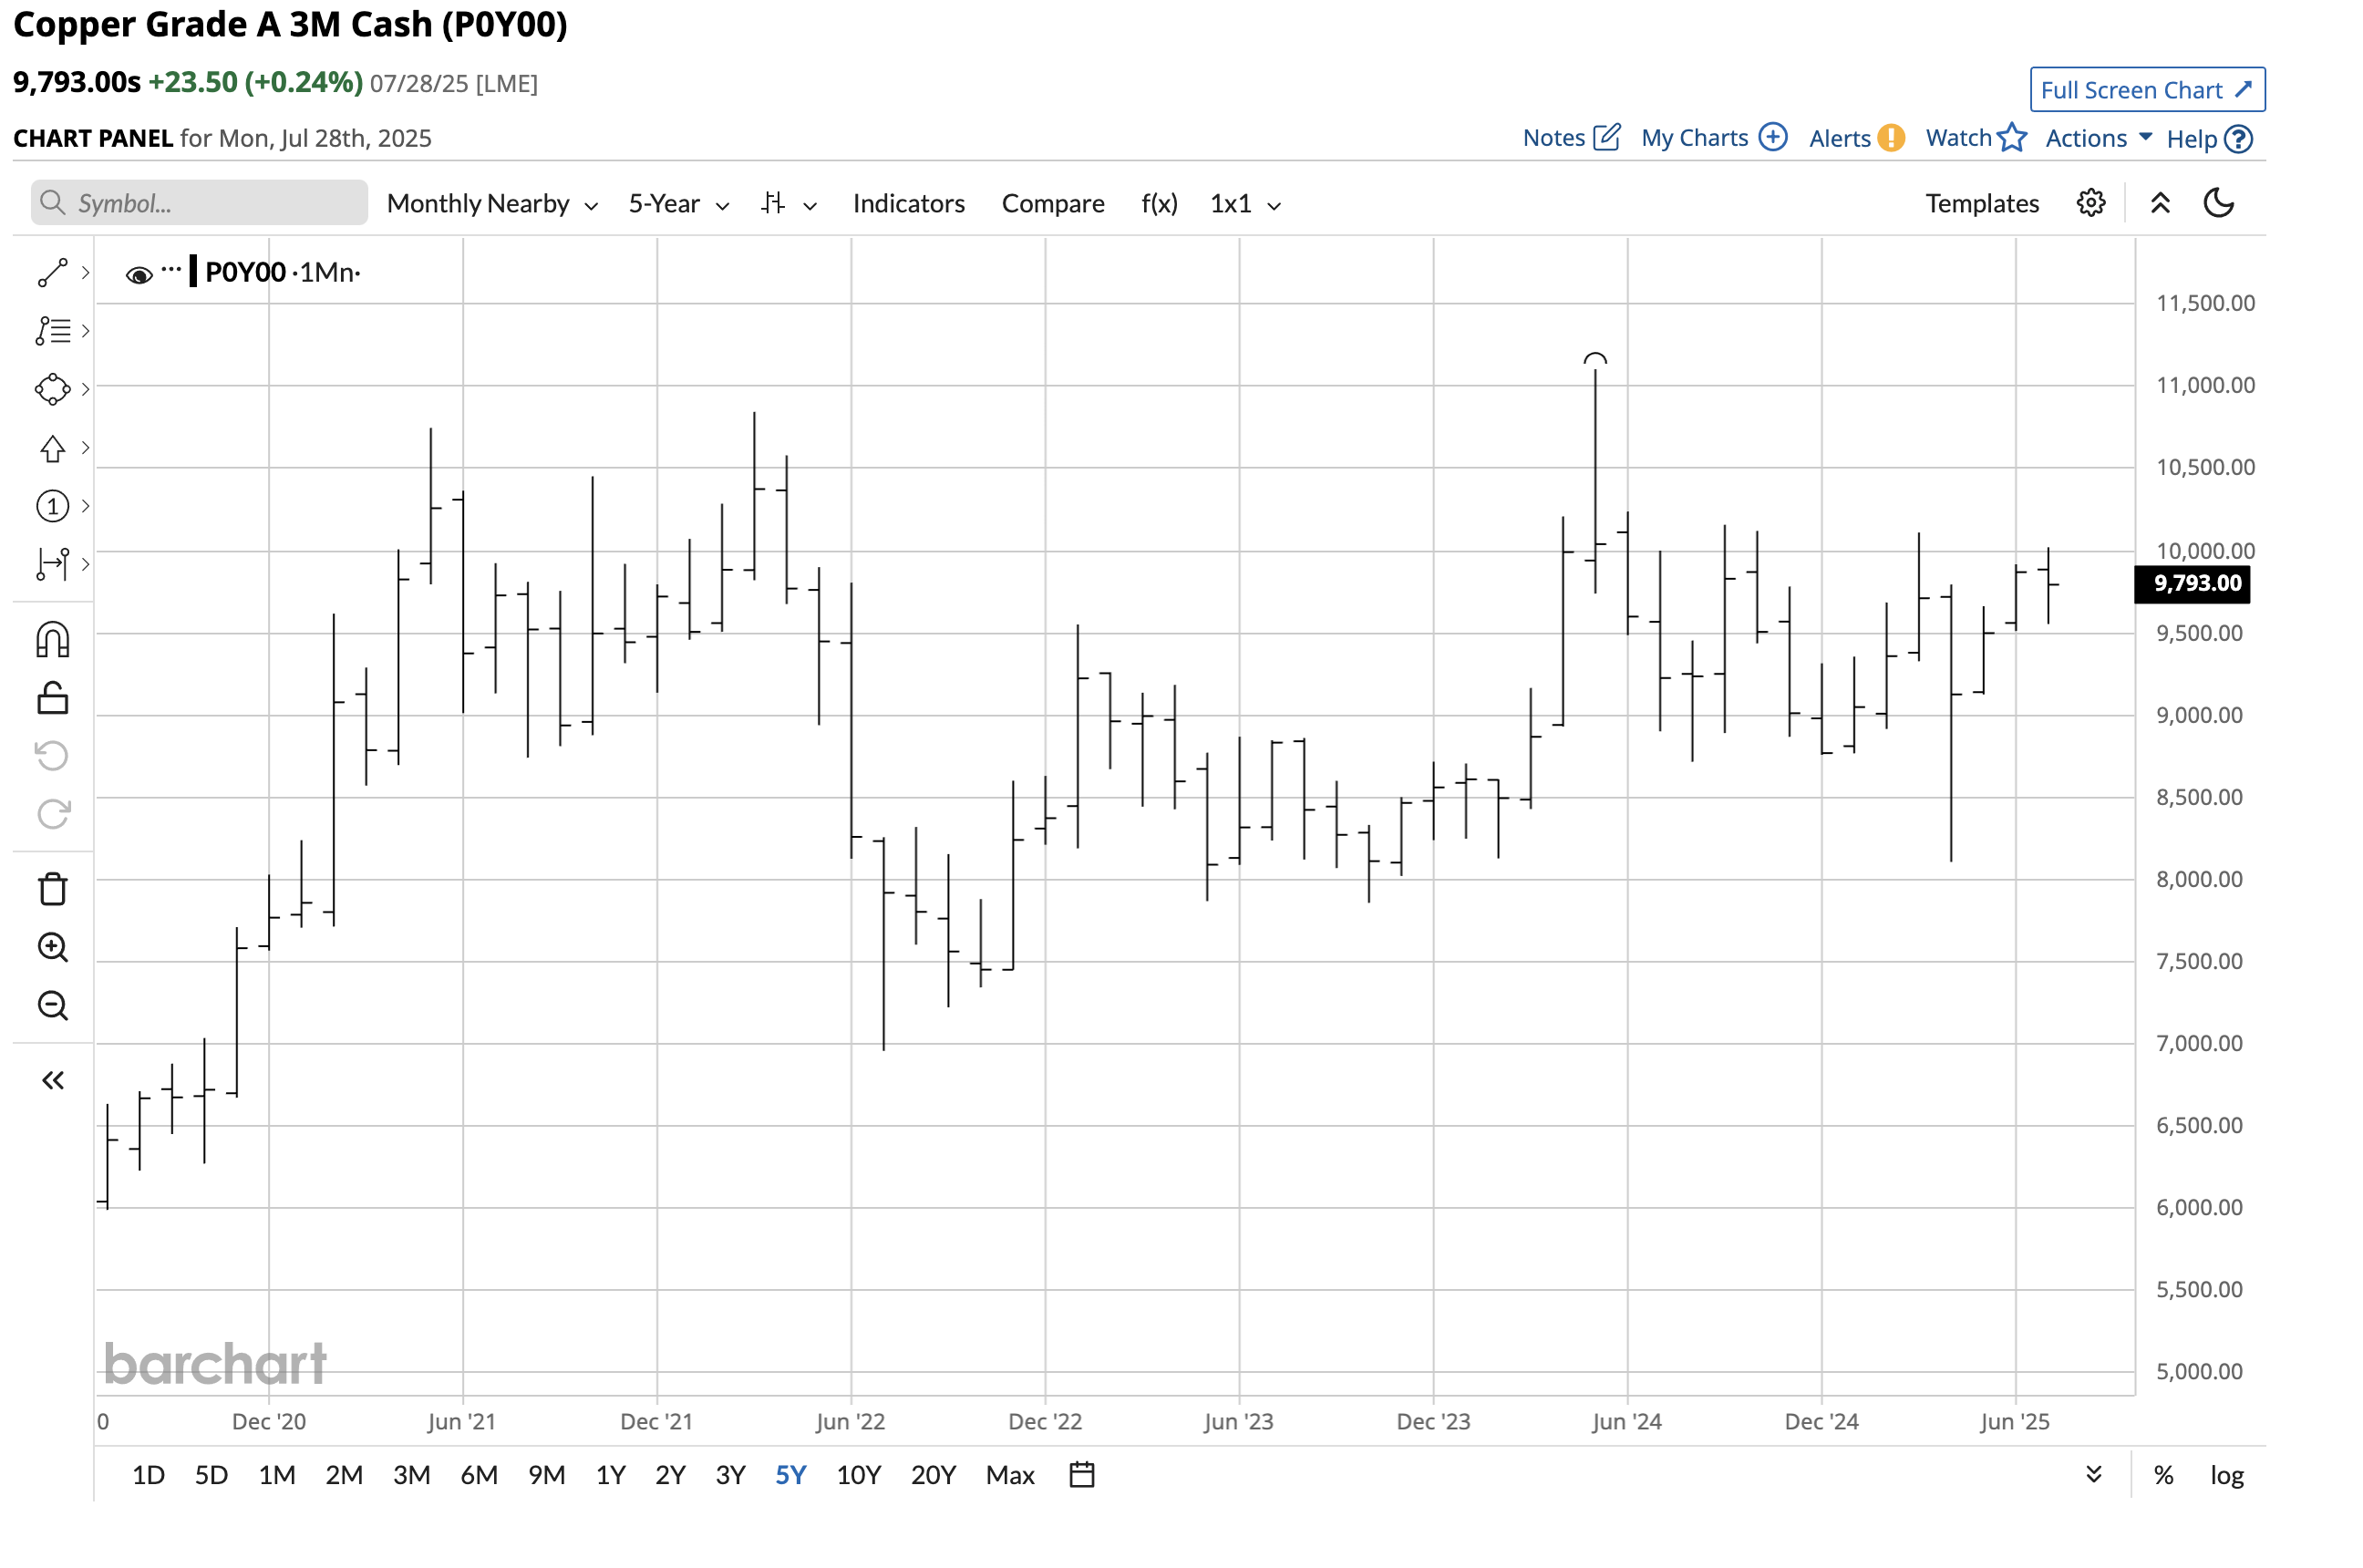
The monthly three-month LME forward chart shows that copper forwards reached $10,110.49 per ton in March 2025, which was below the record May 2024 high of $11,104.50. After falling to $8,105 in April 2025, the forwards rallied to $10,020.50 per metric ton in July, below the peaks in March 2025 and May 2024. The copper forwards were below the $9,800 level on July 28.
Tariffs cause price distortions- Copper is a case study on the trade barriers
COMEX copper warehouses are in the U.S., while LME copper warehouses are in the United Kingdom and other countries. Tariffs are trade barriers that distort prices, creating locational premiums and discounts.
The divergence between COMEX futures and LME forward copper prices serves as a case study in the impact of tariffs. Over the past few months, LME warehouse stocks have declined, while COMEX stockpiles have grown, as the market prepared for copper tariffs. The lead-up to the tariff announcement in March pushed the COMEX futures to new highs, while the initial April 2 exclusion caused the COMEX futures to plunge. The 50% tariff announcement sent the futures to new record highs. While the price action in the futures market caused rallies and declines in the LME copper market, the forwards have remained below the May 2024 record high throughout 2025.
The fundamentals continue to support higher copper prices
Supply and demand fundamentals continue to support higher copper prices for the following reasons:
- Global copper demand is rising as the red metal is a critical input in green energy initiatives.
- China is the world’s leading consumer of refined copper. Any improvement in the Chinese economy will only increase the demand side of copper’s fundamental equation.
- It takes the better part of a decade to bring new copper mines into production.
- Many of the new mines are located in politically challenged countries, such as the DRC, the Democratic Republic of the Congo, and Indonesia, which creates production, logistical, and other roadblocks.
- Copper’s bull market began decades ago, and the price continues to make higher lows and higher highs.
When technical and fundamental factors are bullish, the price action can turn explosive, as we have witnessed in the COMEX futures. The trade barriers have only accelerated and exacerbated the rallies and price volatility over the past months.
CPER tracks the copper futures
At $34.87 per share, the U.S. Copper ETF product (CPER) had over $230.4 million in assets under management. CPER trades an average of 273,011 shares daily and charges a management fee of 0.88%.
Continuous COMEX copper futures rallied 47.9% from $4.03 on April 7 to $5.9585 on July 24, 2025.
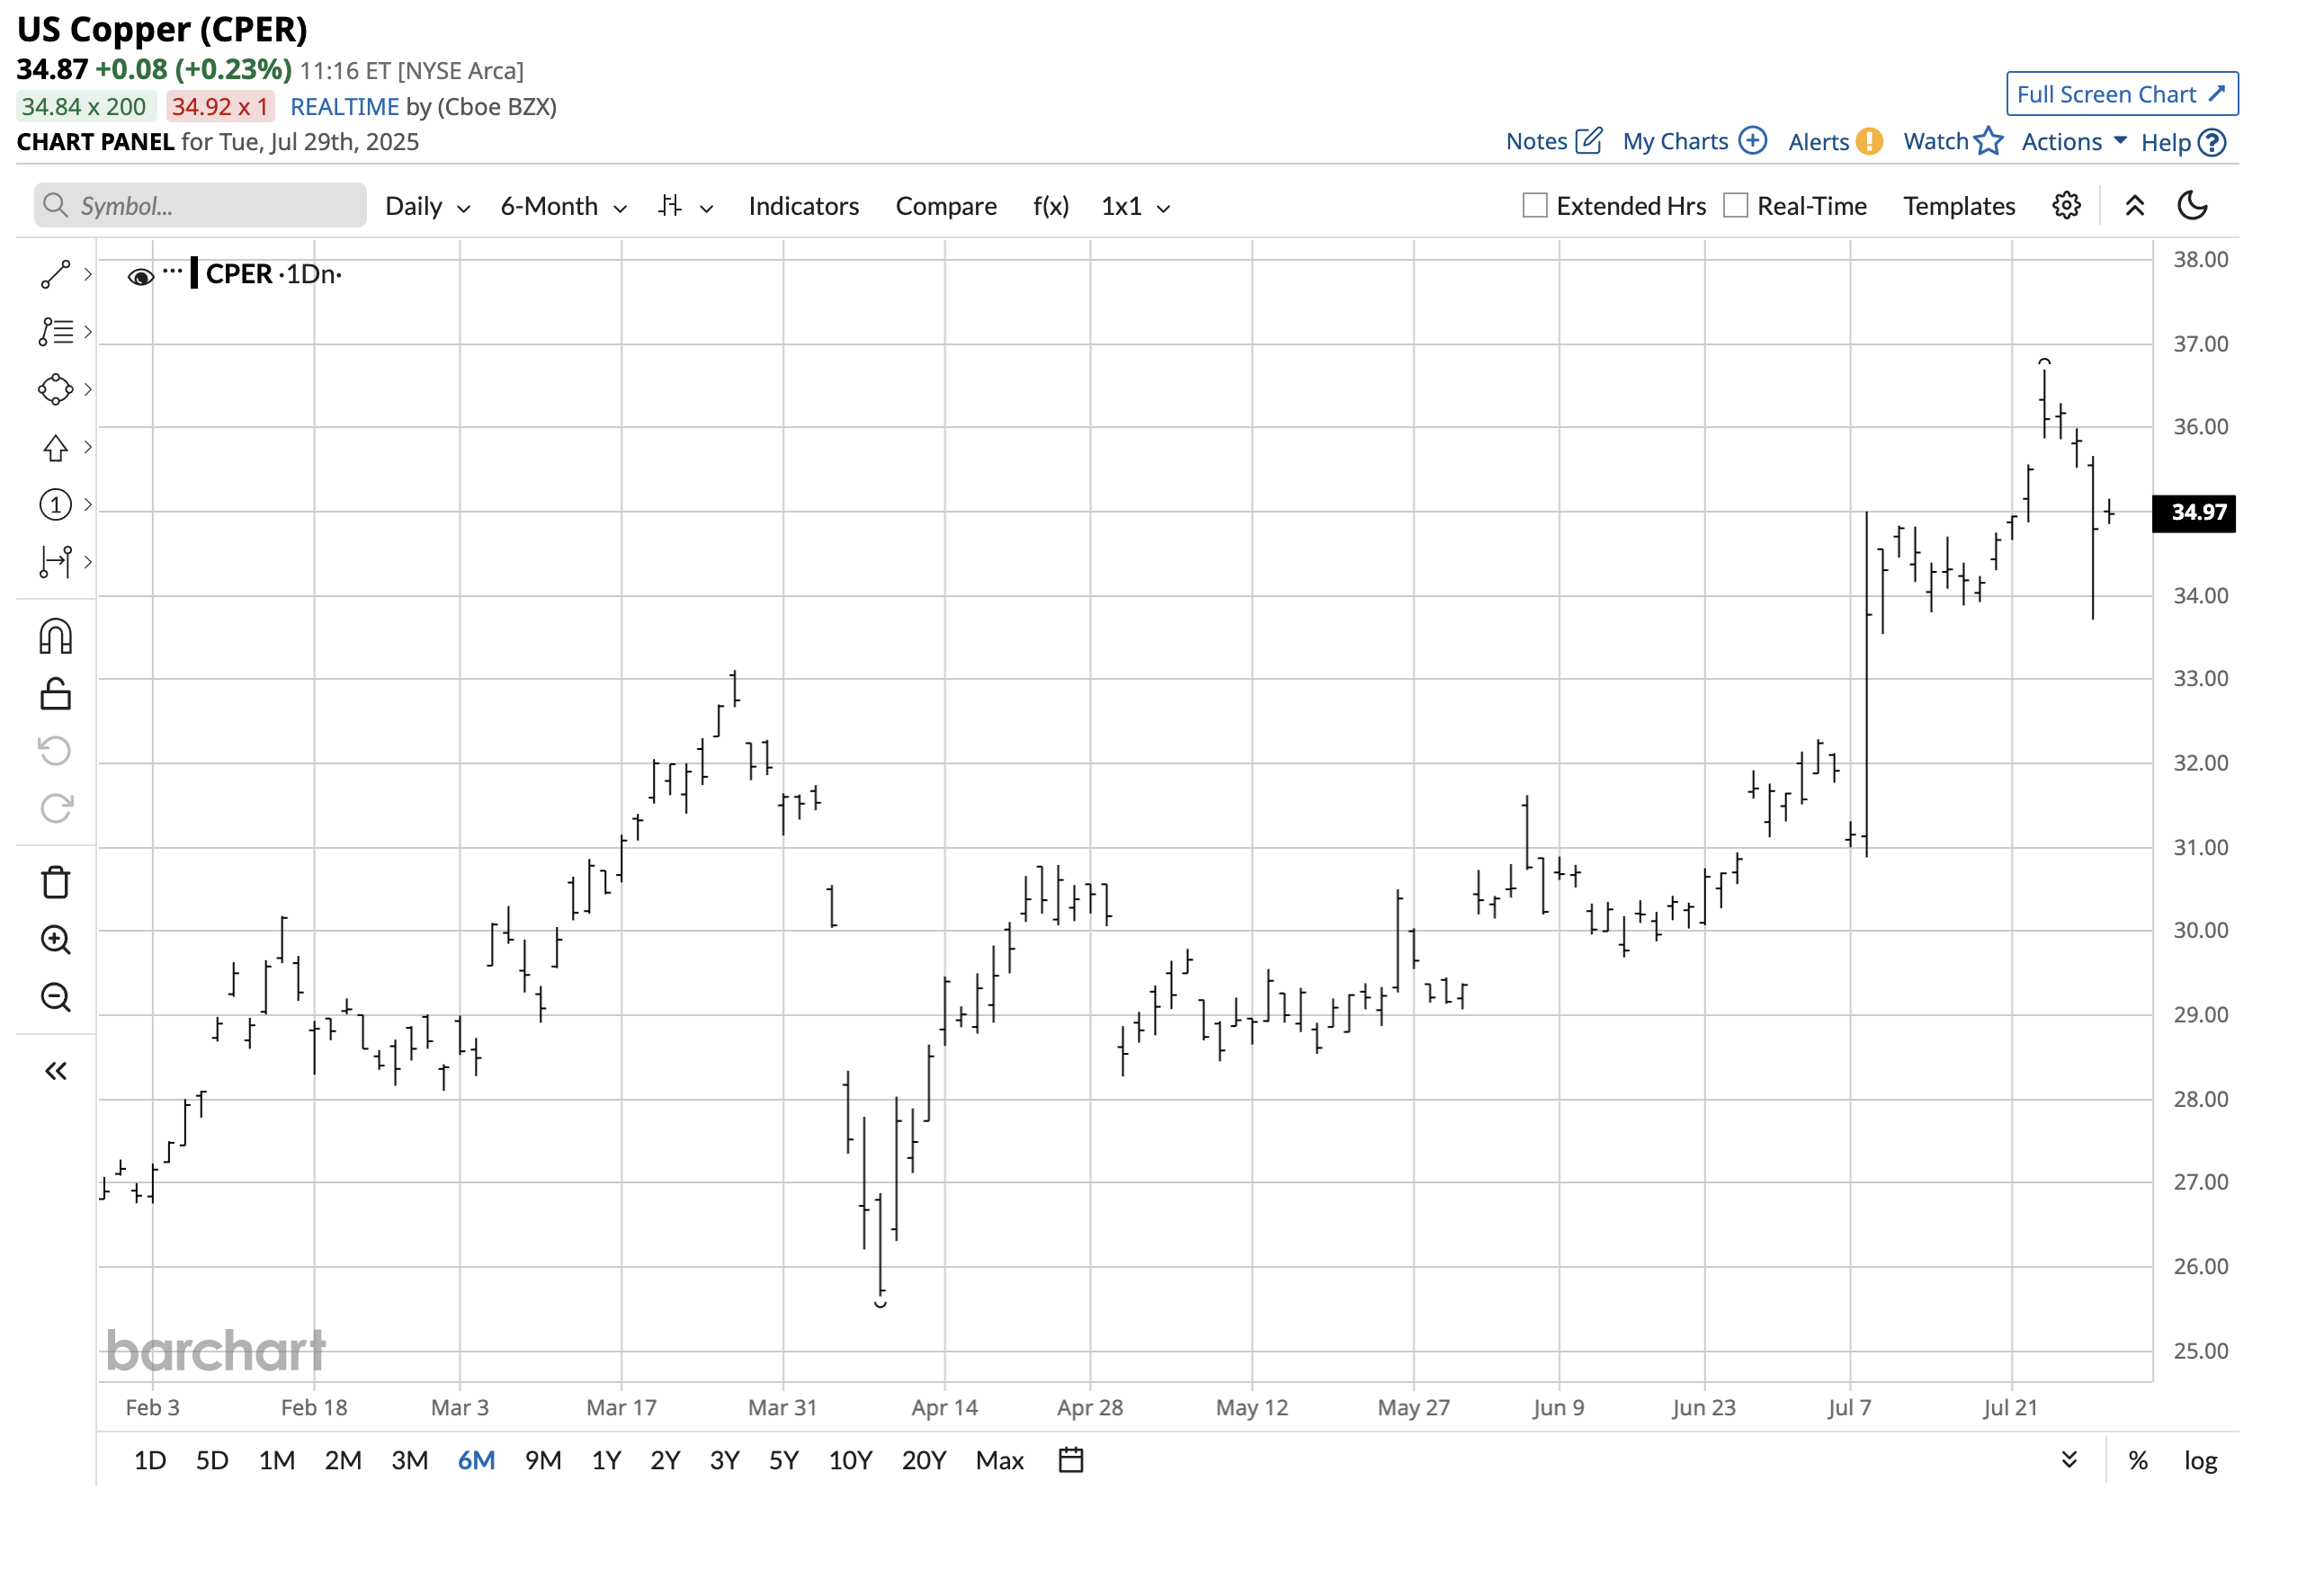
The chart highlights a 43% rally in the CPER ETF, which moved from $25.65 to $36.69 per share over the period. Over around the same period, the LME three-month forwards increased by 23.63% from $8,105 to $10,020.50 per metric ton.
While CPER tracks the futures prices, the ETF only trades during U.S. stock market hours, so it may miss highs or lows that occur when the stock market is closed.
Copper remains in a bullish trend as of late July 2025, with both fundamental and technical factors indicating higher prices. While copper prices could experience future volatility, keep an eye on the differential between the LME forwards and the COMEX futures. If the spread begins to narrow, it will further validate the fundamental strength of copper.
Update on Copper
Copper futures plunged on July 30 and 31 after the Fed meeting and following President Trump's signing of an executive order imposing a 50% tariff on the import of some copper products.
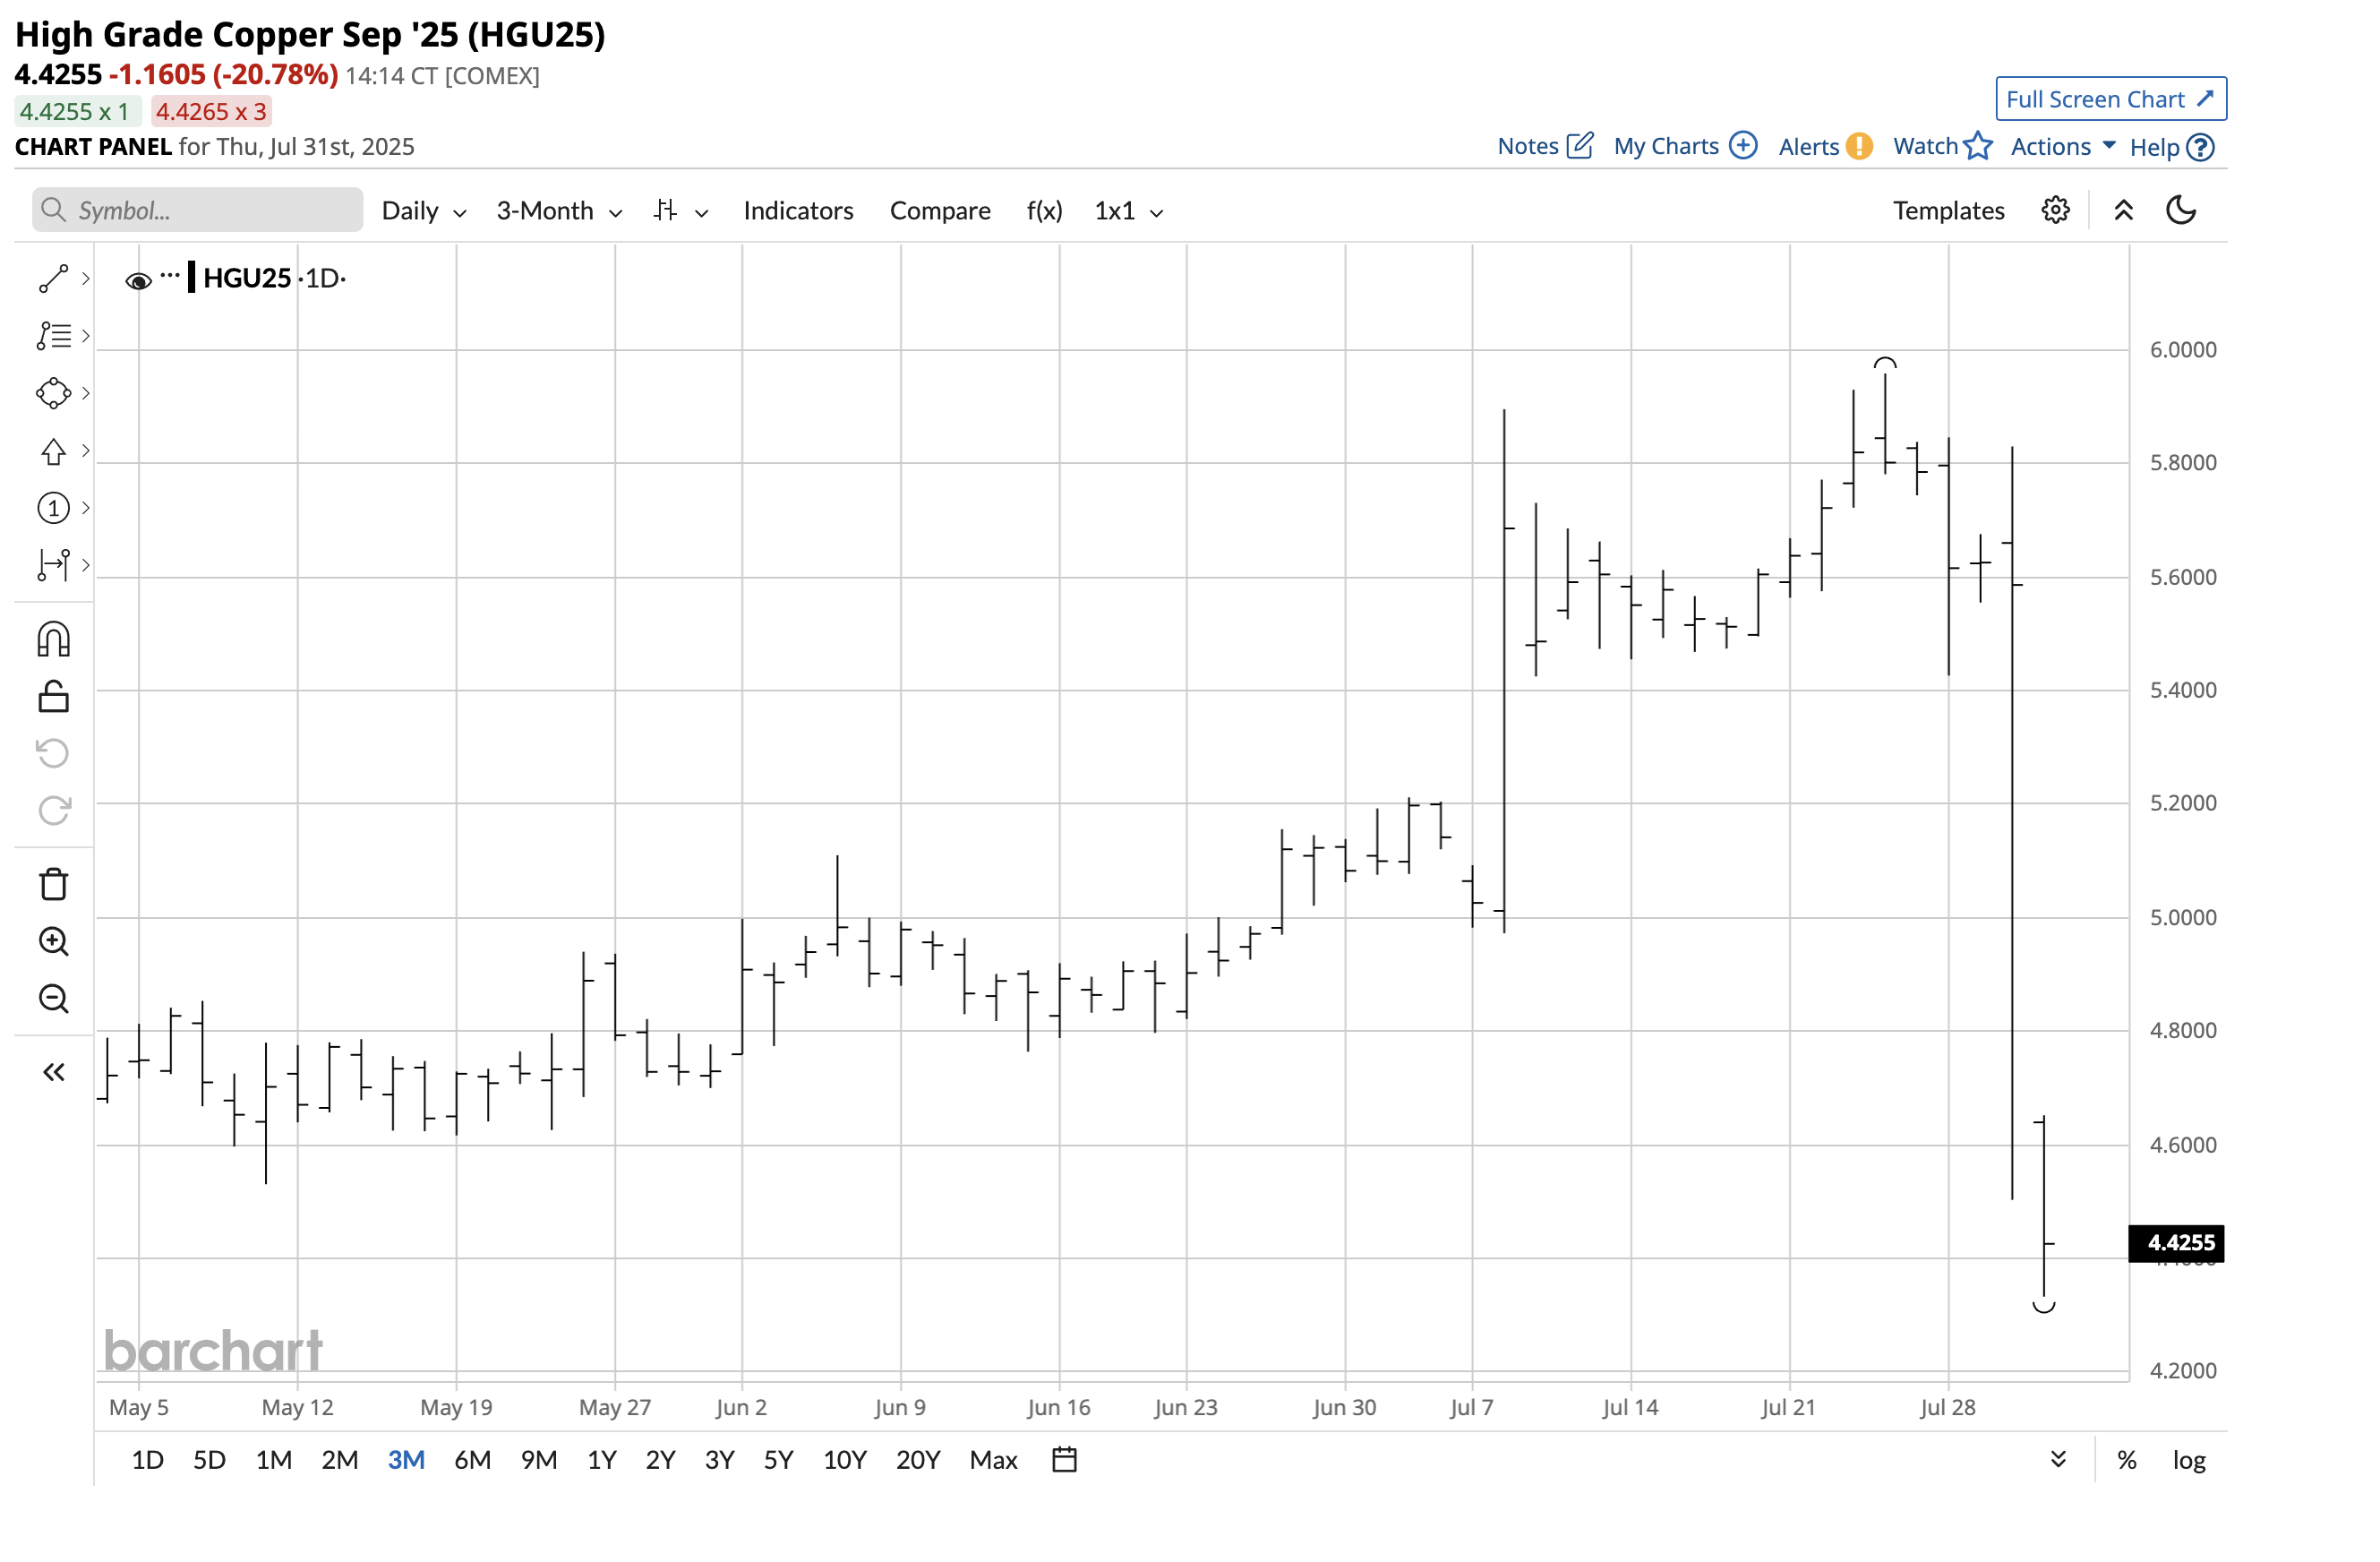
The daily chart highlights the price plunge that took COMEX copper futures for September delivery to a low of $4.3325 on July 31. Critical technical support is around the $4 level. If the price action over the past decade and a half is a clue, copper futures should hold above the $4 level after the recent dramatic correction. The spread between LME copper forwards and the COMEX futures substantially narrowed because of the plunge in the futures prices. I remain bullish on copper prices because of the red metal's compelling fundamentals. Time will tell if $4 holds during the current selloff that has turned the futures market into a falling copper knife.
On the date of publication, Andrew Hecht did not have (either directly or indirectly) positions in any of the securities mentioned in this article. All information and data in this article is solely for informational purposes. For more information please view the Barchart Disclosure Policy here.