Amazon.com Inc. (NASDAQ:AMZN) and Alphabet Inc. (NASDAQ:GOOG) (NASDAQ:GOOGL) both entered downtrends on Aug. 16.
When the S&P 500 rejected the 200-day simple moving average at the top of the last short-term bull cycle. The two tech giants hold the third and fifth and sixth spots in terms of the SPY’s weightings, with Amazon weighted at 7.64% and Alphabet Class A and Class B weighted at 4.04% and 3.85%, respectively.
Perhaps unsurprisingly, Amazon and Google’s charts have a similar look to both each other and to the SPY, showing a multiday decline with a consistent series of lower highs and lower lows.
The S&P 500 hinted at a bear market in mid-March, when the 50-day simple moving average (SMA) crossed below the 200-day SMA, creating a death cross, which made bullish traders grow cautious. On June 13, when the ETF fell more than 20% off its all-time high, the bear market officially took hold.
Between June 17 and Aug. 16, a bull cycle occurred in the general markets, which helped Amazon to surge about 42%. Google had a much shorter bull cycle, rising about 17% between July 26 and Aug. 16. The move had bullish traders hoping the bear market may be over.
Within every bear cycle, bounces to the upside occur and bullish periods take place. For traders and investors, the periods when individual stocks move anti-trend can be confusing because it’s difficult to decipher whether moves to the upside are a temporary bounce or whether the bear cycle is ending and a bull cycle is about to begin.
For technical traders, remaining agile is the key to success. Although it’s not possible to predict with certainty when a bear cycle will end, charts can help to provide clues as to whether there’s likely more upside in the short term.
From a technical standpoint, Amazon and Google are likely to bounce up over the next few trading days but the longer-term patterns remain bearish. With Amazon showing relative strength compared to Google, a move higher in the former may indicate a bounce in the latter is on the horizon.
It should be noted that events affecting the general markets, negative or positive reactions to earnings prints and news headlines can quickly invalidate patterns and breakouts. As the saying goes, "the trend is your friend until it isn't" and any trader in a position should have a clear stop set in place and manage their risk versus reward.
Want direct analysis? Find me in the BZ Pro lounge! Click here for a free trial.
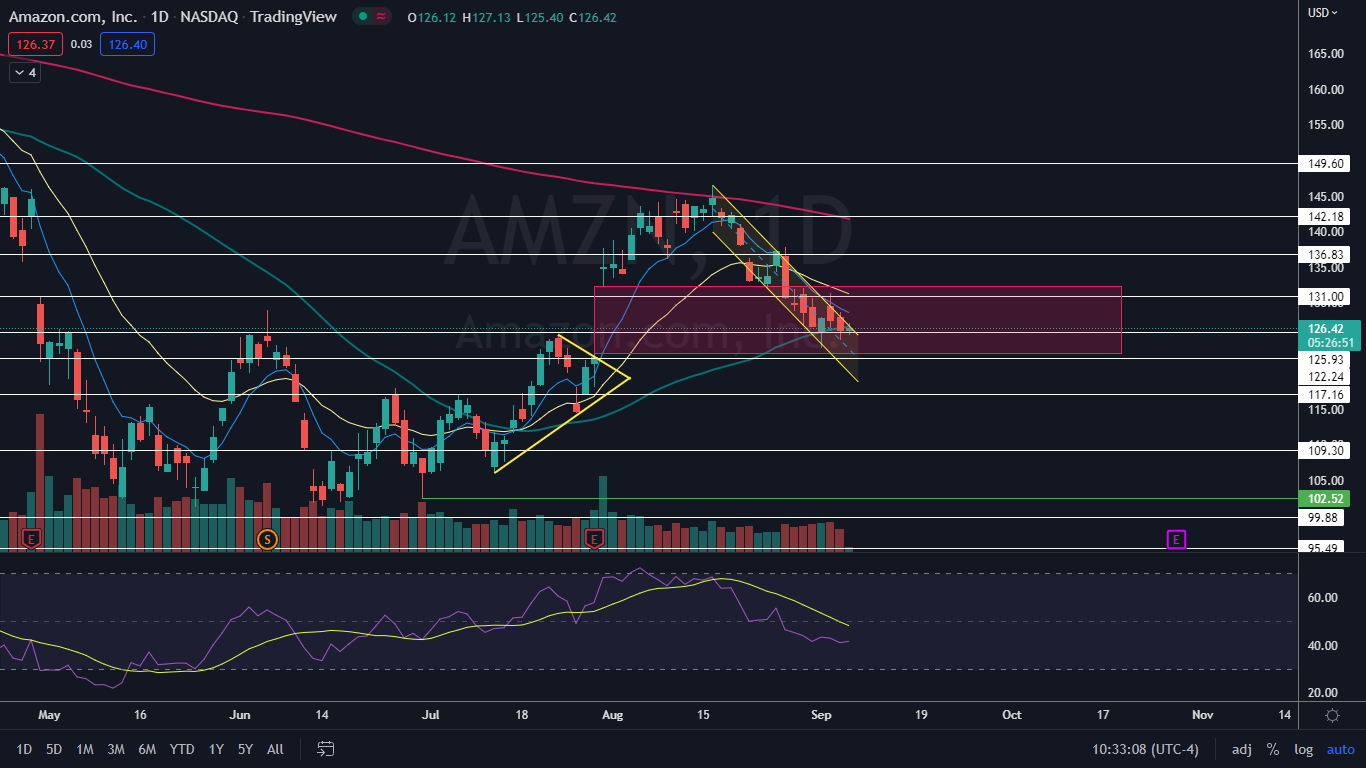
The Amazon Chart: Amazon has been trading in a falling channel since Aug. 16, making a consistent series of lower highs and lower lows. On Wednesday morning, Amazon attempted to break up from the upper descending trendline of the channel but failed, wicking from the area.
- Amazon is also working to print an inside bar on the daily chart, with all of Wednesday’s price action taking place within Tuesday’s trading range. The pattern leans bearish in this case because the stock was trading lower before forming the inside bar.
- Amazon has been trading within a gap since Aug. 26 but hasn’t yet completely filled the lower range. If Amazon falls to $122.84 to completely fill the gap, bullish traders can watch for the stock to print a bullish candlestick, such as a doji or hammer candlestick, at the level to indicate a bounce to the upside is on the horizon.
- On Wednesday, Amazon opened the trading session under the 50-day simple moving average on the daily chart, which is bearish. Bulls will want to see the stock regain the level for more confidence going forward.
- Amazon has resistance above at $131 and $136.83 and support below at $125.93 and $122.24.
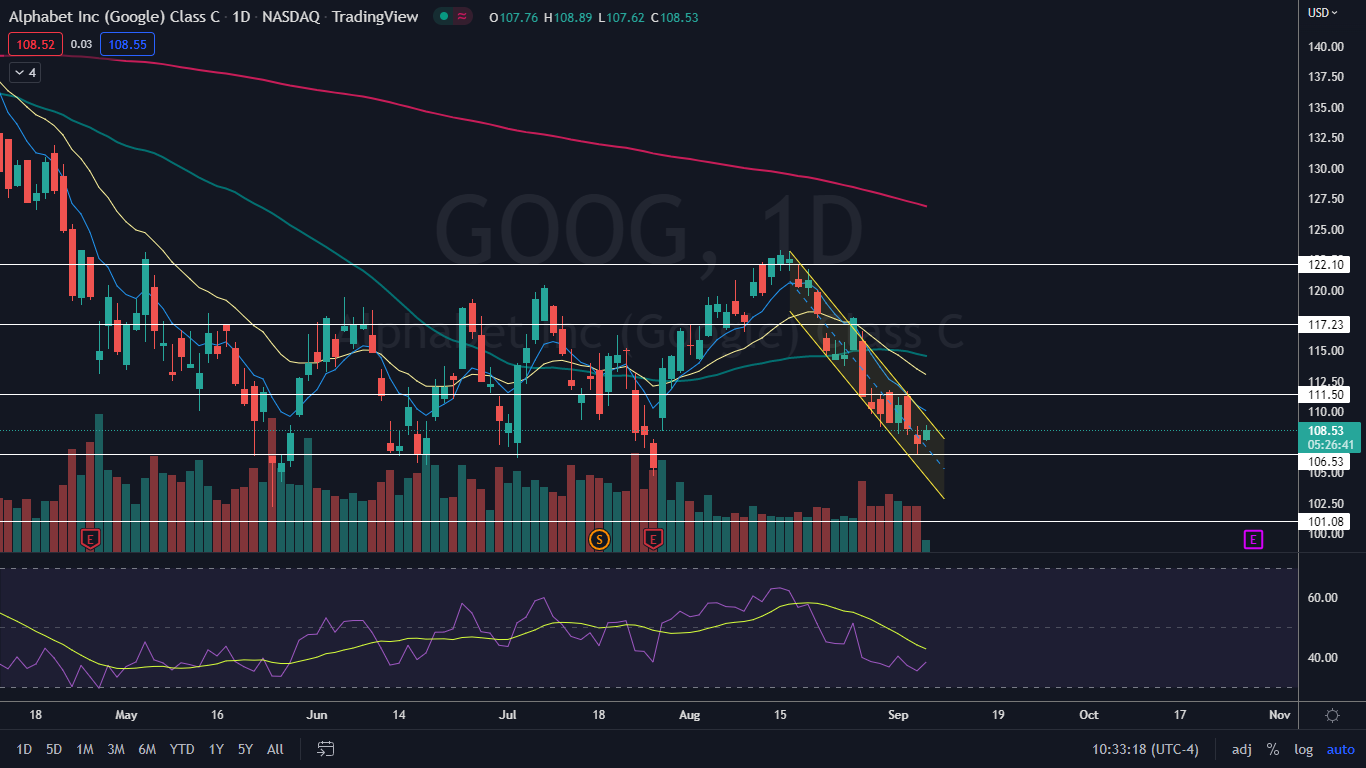
- Also like Amazon, Google was forming an inside bar pattern on Wednesday. Although Google was showing relative strength over Amazon, as of late morning, the stock was unable to break up above Tuesday’s high of day, which indicates consolidation.
- Google is trading below the 50-day SMA, and unlike Amazon, Google’s 50-day has curled downwards. This suggests the indicator may continue to guide Google lower over time.
- Google has resistance above $111.50 and $117.23 and supports below $106.53 and $101.08.