On Thursday evening, Benzinga asked its followers on Twitter Inc (NYSE:TWTR) what they were buying at the open on Friday. From the replies, Benzinga selected one ticker for technical analysis.
@JeridFruge, @wolfhunter1450, @Aaron_529 and @ger2619 is buying Camber Energy Inc (NYSE:CEI).
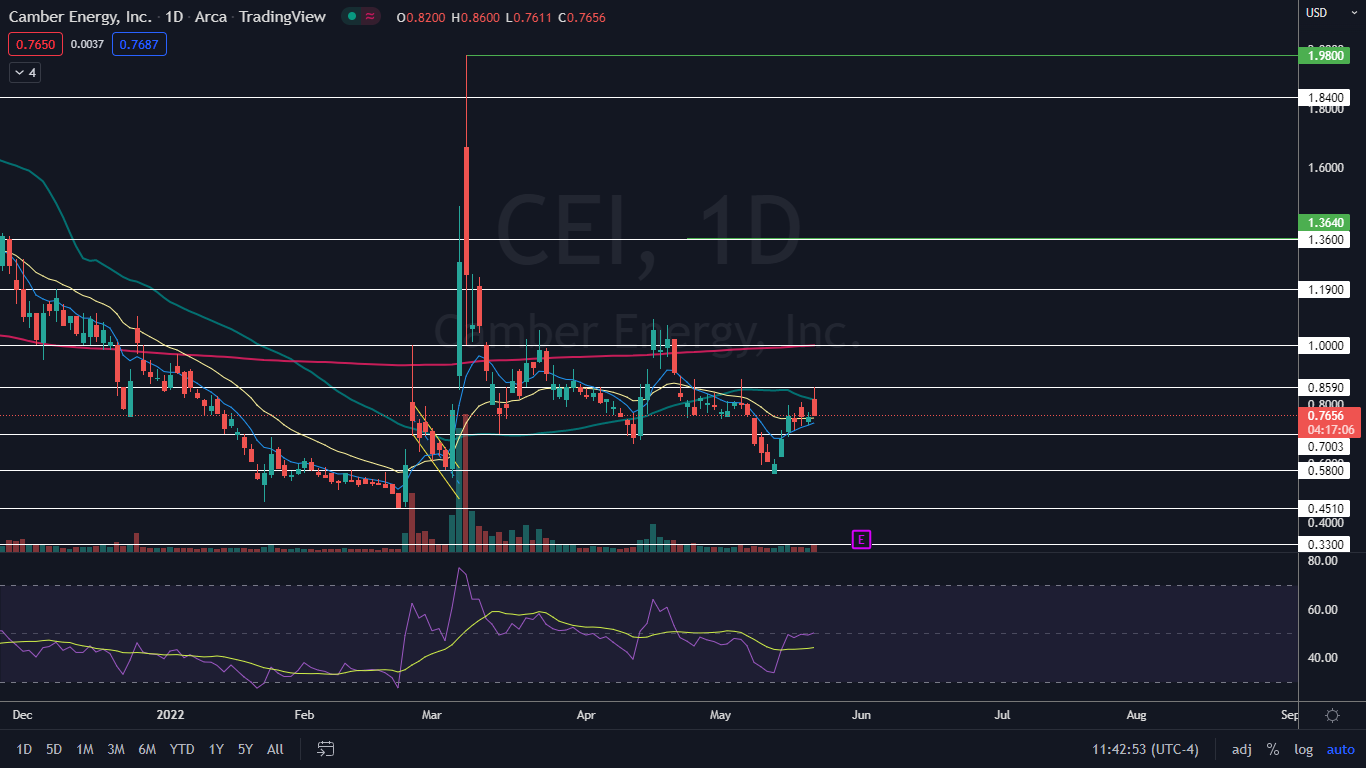
Camber Energy avoided being delisted on Friday by filing a number of overdue financial documents with the U.S. Securities and Exchange Commission on the day of the final deadline. The crude oil and natural gas producer was initially given an extension of April 1 but requested a second extension, which was granted.
The news excited bullish retail traders, who had anticipated Camber Energy would meet the deadline and the stock gapped up more than 8% to start the trading day before being dragged down by the S&P 500, which was trading down about 0.7%.
From a technical standpoint, Camber Energy looked set to trade higher because the stock had developed a bull flag on its daily chart.
The bull flag pattern is created with a sharp rise higher forming the pole, which is then followed by a consolidation pattern that brings the stock lower between a channel with parallel lines or into a tightening triangle pattern.
- For bearish traders, the "trend is your friend" (until it's not) and the stock may continue downwards within the following channel for a short period of time. Aggressive traders may decide to short the stock at the upper trendline and exit the trade at the lower trendline.
- Bullish traders will want to watch for a break up from the upper descending trendline of the flag formation, on high volume, for an entry. When a stock breaks up from a bull flag pattern, the measured move higher is equal to the length of the pole and should be added to the lowest price within the flag.
A bull flag is negated when a stock closes a trading day below the lower trendline of the flag pattern or if the flag falls more than 50% down the length of the pole.
Want direct analysis? Find me in the BZ Pro lounge! Click here for a free trial.
The Camber Energy Chart: Unfortunately, the bull flag break out has so far ended up being a bull trap because as of press time, Camber Energy had given back all of its gains to trade flat to Thursday’s closing price. The bull flag was formed between May 12 and Thursday, with the pole created during the first three trading days of the timeframe and the flag formed on the days since then.
- If the markets turn bullish next week, there is a possibility Camber Energy could provide the true break out from the bull flag and the good news is that the higher high formed on Friday has set the stock into an uptrend. Bullish traders who aren’t already in a position can watch for a higher low to eventually develop above the $73-cent area for a solid entry point.
- Camber Energy regained support at the eight-day and 21-day exponential moving averages (EMAs) on Friday, which is bullish. More conservative traders may want to wait for the eight-day EMA to cross above the 21-day, which would give them more confidence going forward.
- Bearish traders want to see Camber Energy lose support at the EMAs, which could push the stock down to form a lower low and negate the uptrend.
- Camber Energy has resistance above at $85 cents and $1 and support below at 70 cents and the 58-cent mark.