Oracle Corporation (NYSE:ORCL), Pfizer Inc (NYSE:PFE) and Palantir Technologies Inc (NYSE:PLTR) were all trading near to flat on Thursday in contrast to the S&P 500, which was exhibiting a high level of volatility and lack of clear direction.
The three stocks are all trading in confirmed uptrends on their daily charts. An uptrend occurs when a stock consistently makes a series of higher highs and higher lows on the chart.
The higher highs indicate the bulls are in control while the intermittent higher lows indicate consolidation periods.
Traders can use moving averages to help identify an uptrend, with rising lower time frame moving averages (such as the eight-day or 21-day exponential moving averages) indicating the stock is in a steep shorter-term uptrend.
Rising longer-term moving averages (such as the 200-day simple moving average) indicate a long-term uptrend.
A stock often signals when the higher high is in by printing a reversal candlestick such as a doji, bearish engulfing or hanging man candlestick. Likewise, the higher low could be signaled when a doji, morning star or hammer candlestick is printed. Moreover, the higher highs and higher lows often take place at resistance and support levels.
In an uptrend the "trend is your friend" until it’s not and there are ways for both bullish and bearish traders to participate in the stock:
- Bullish traders who are already holding a position in a stock can feel confident the uptrend will continue unless the stock makes a lower low. Traders looking to take a position in a stock trading in an uptrend can usually find the safest entry on the higher low.
- Bearish traders can enter the trade on the higher high and exit on the pullback. These traders can also enter when the uptrend breaks and the stock makes a lower low indicating a reversal into a downtrend may be in the cards.
Want direct analysis? Find me in the BZ Pro lounge! Click here for a free trial.
The Oracle Chart: Oracle may be reversing course into an uptrend, after printing a double bottom pattern at the $66.38 mark on June 22 and June 23. The most recent higher high was printed on June 28 at $71.07 and the most recent higher low appears to be forming at Thursday’s low-of-day.
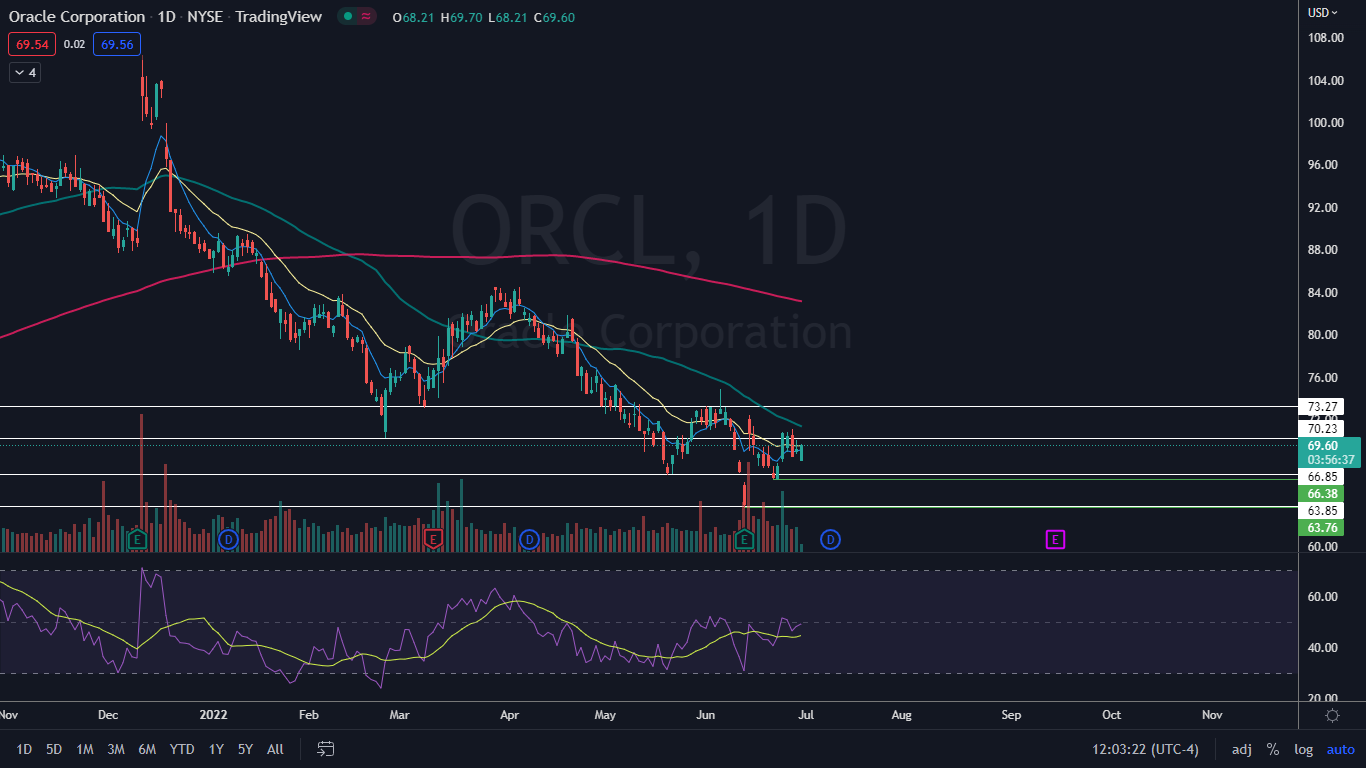
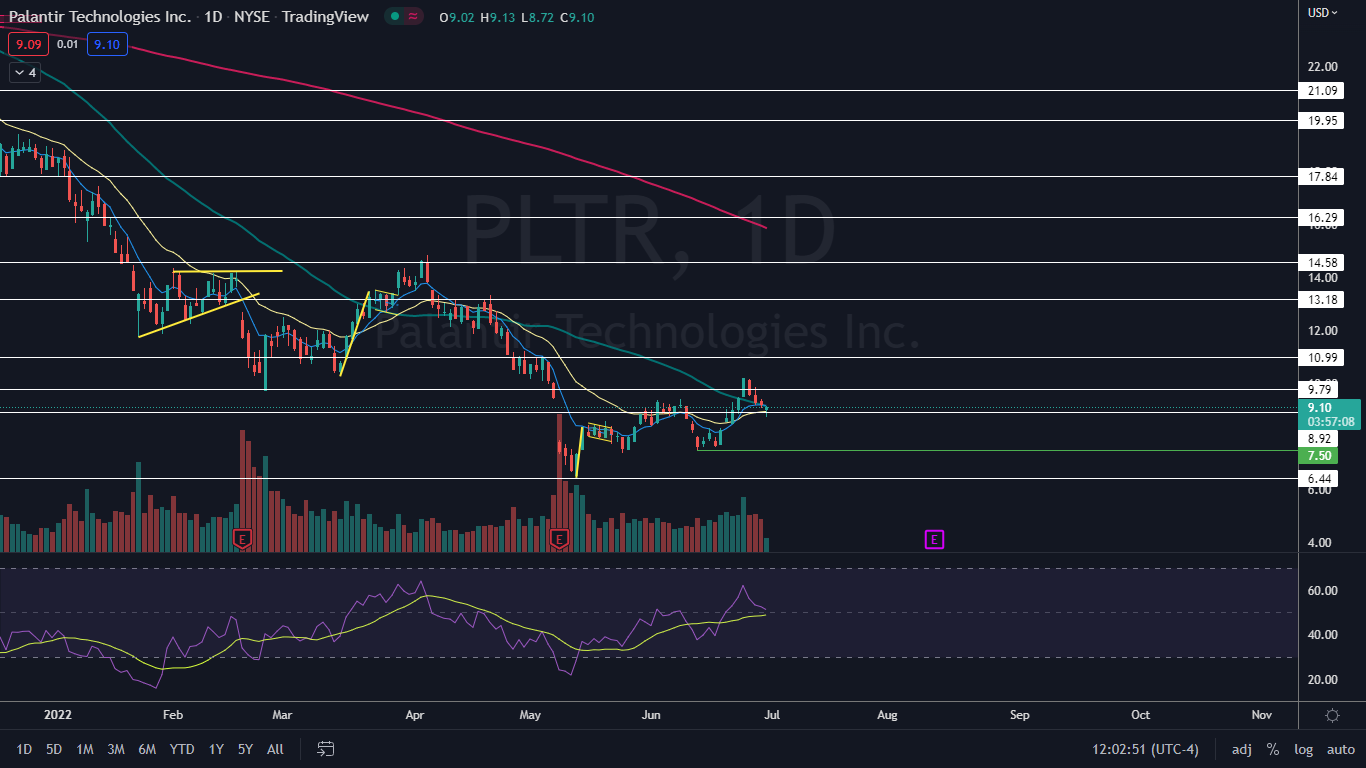
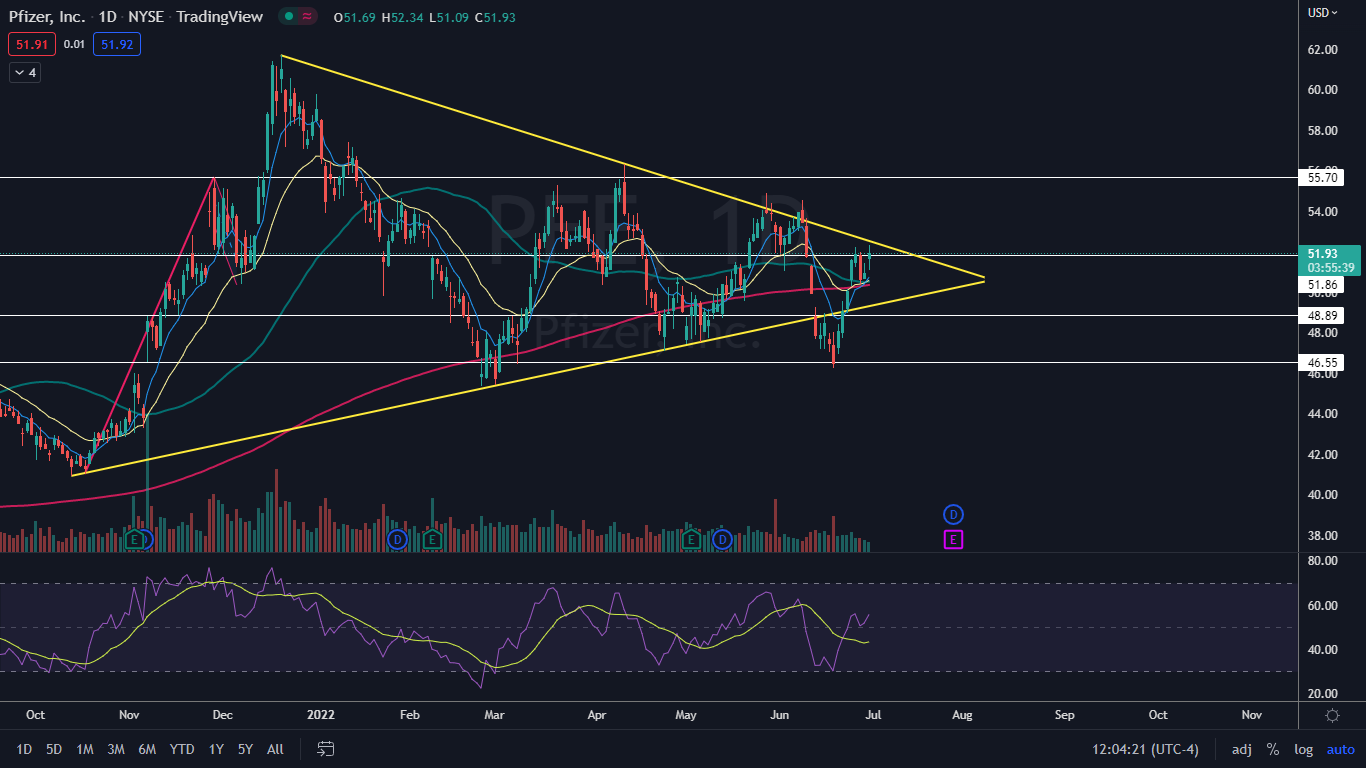
Photo: thinkhubstudio via Shutterstock