In a July 24, 2025, Barchart article on U.S. government bonds and the TLT ETF that tracks the debt securities, I concluded with the following:
The range since the beginning of 2024 highlights the technical support and resistance levels. If rising U.S. debt levels lead to selling in the bond market, TLT is likely to head lower. However, if the debt doesn’t matter and the U.S. can reduce spending and grow its way out of the debt through economic initiatives, the TLT will likely rally. For now, long-term interest rates and the TLT remain in a trading range, closer to the lows than the highs since early 2024, and are waiting for the next economic shoe to drop. Expect short-term rates to decline, but the path of long-term rates depends on the success of current economic initiatives.
The nearby U.S. 30-year Treasury bonds were trading at the 113-12 level on July 23, with the TLT ETF at $85.97 per share. The bonds and TLT have moved higher since July 23.
The bonds rally
The U.S. 30-year Treasury Bond futures contract has traded in a narrow range in 2024 and 2025, close to the bottom end of the bearish trend that has been in place since the pandemic-inspired high in March 2020.
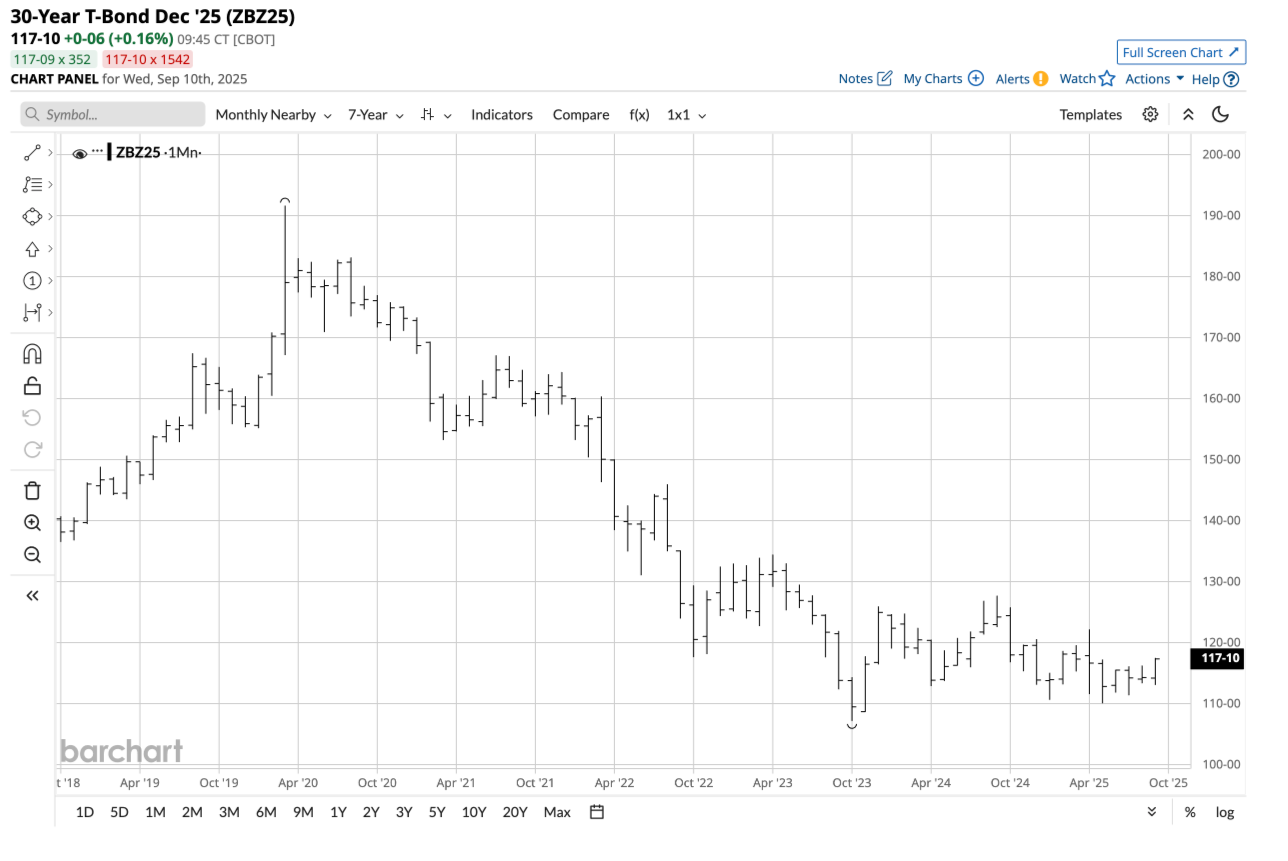
The seven-year monthly chart highlights the decline from the March 2020 high of 191-22 to the October 2023 low of 107-04. Since December 2023, the long bond futures have traded in a 110-01 to 127-22 range. At the 117-10 level in September 2025, the bond futures are just below the midpoint of the nearly two-year trading range.
While the long bond futures are higher than the level on July 23, they remain in a tight range as long-term interest rates remain elevated.
TLT is higher, but in a tight trading range
The iShares 20+Year Treasury Bond ETF (TLT) is a highly liquid product that tracks U.S. government long-term interest rates.
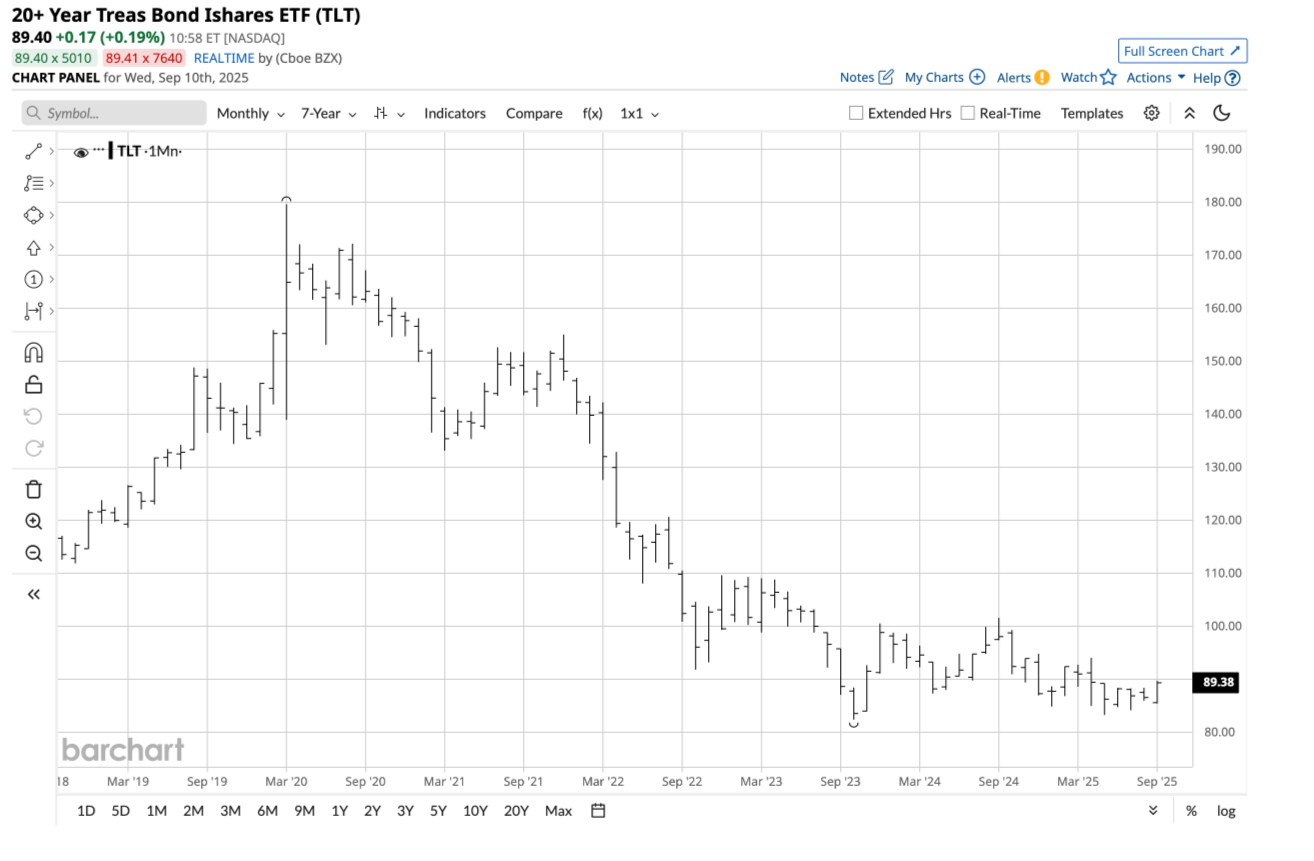
The seven-year monthly chart shows that TLT tracks the long bond futures.
The chart highlights the decline from the March 2020 high of $179.70 to the October 2023 low of $82.42 per share. Since December 2023, the TLT ETF has traded in a $83.30 to $101.64 per share range. At the $89.40 level in September 2025, the TLT ETF is under the midpoint of the nearly two-year trading range.
While the TLT ETF is higher than the level on July 23, it remains in a tight range as long-term interest rates remain elevated.
A Fed Funds Rate cut in September
Federal Reserve Chairman Jerome Powell signaled that the central bank was ready to reduce the short-term Fed Funds Rate from a midpoint of 4.375% at the Fed’s annual August 2025 Jackson Hole gathering. Chairman Powell told markets, “With policy in restrictive territory, the baseline outlook and the shifting balance of risks may warrant adjusting our policy stance.” After leaving the Fed Funds Rate unchanged throughout 2025, the central bank signaled that a rate cut is on the horizon for the September 17-18 FOMC meeting. The Fed had forecast a 50 basis point cut in 2025, which could lead to a 25 or 50 point reduction at the September meeting.
Meanwhile, President Trump has not been shy about his feelings that the Fed is “too late” with cuts. Treasury Secretary Scott Bessent has said that rates should be at least 150 basis points lower, saying, “I think we could go into a series of rate cuts here, starting with a 50 basis-point rate cut in September. If you look at any model, we should probably be 150, 175 basis lower.” President Trump believes rates should fall even more. The latest economic data on employment and inflation suggest the increased potential for a 50 basis point Fed Funds Rate reduction on September 18.
Inflation remains elevated
Consumer and producer price index data from July showed inflation remains elevated above the Fed’s 2% target. The latest July personal consumption expenditures price index (PCE), the Fed’s favored inflation indicator, showed that core inflation ran at a 2.9% seasonally adjusted rate. The Fed has not cut the short-term Fed Funds Rate in 2025 due to concerns that U.S. trade policy and tariffs will lead to increasing prices and inflationary pressures. However, inflation has receded from the past few years, when the PCE reading was above 3% from August 2023 through January 2024, over 4% from December 2022 through July 2023, and mostly north of 5% from December 2021 through November 2022. August PPI data suggested lower inflationary pressures.
However, with inflation nearly 1% above the Fed’s optimal target, economic conditions could curb the central bank’s enthusiasm for rate cuts, leading to a 25 basis point reduction on September 18, 2025. At this point, the debate is over a 25 or 50 point reduction, and I believe the Fed will make a statement and cut rates by half a percentage point.
Meanwhile, short-term Fed Funds rate cuts will not necessarily lead to lower long-term U.S. interest rates. While the Fed controls short-term rates as its primary monetary tool, longer-term rates are controlled by market forces. Therefore, the U.S. credit rating, U.S. debt levels at approximately $37.3 trillion, foreign demand for U.S. government bonds, and other factors will determine the path of long-term U.S. interest rates.
Tariffs and trade deals are critical for the path of least resistance of long-term interest rates
As the impact of tariffs filters through the U.S. economy, inflationary pressures will determine the path of least resistance of U.S. government bond prices and interest rates further along the yield curve.
The Trump administration will replace Chairman Powell in 2026, and the incoming central bank leader will likely reflect the administration’s desire for lower short-term and long-term rates.
Moreover, any unforeseen events that cause a flight to quality could lift bond prices and lower long-term yields if history repeats. The U.S. bond market and currency remain the most stable for global reserves, which favors the upside in turbulent times.
With long bonds and TLT below the midpoint of their trading range over the past two years, the odds favor a recovery if the technical support levels at 110 and 107-04 holds. U.S. bonds can rally, and risk-reward at the current support and resistance levels favors the upside, even if the range remains intact over the coming months and into 2026.
On the date of publication, Andrew Hecht did not have (either directly or indirectly) positions in any of the securities mentioned in this article. All information and data in this article is solely for informational purposes. For more information please view the Barchart Disclosure Policy here.