The equity markets experienced a sharp and broad-based decline on October 10, 2025, marking one of the most significant single-day losses this year, although not a record since the 2022 market crash. Major U.S. indices fell sharply, with the S&P 500 Index ($SPX) down 2.7% and the Nasdaq Composite ($NASX) off more than 3%, as a convergence of macro uncertainty, extreme valuations, and technical breakdowns triggered a wave of algorithmic selling and a perfect storm of downside pressure.
October's Uneasy Legacy
Market historians are quick to note that October has long held a unique place in market lore. The panics of 1907 and 1929, the 1987 crash, the 1997 Asian contagion selloff, and the 2008 financial crisis acceleration all triggered decisive moves in October. While not inherently “cursed,” October often acts as a seasonal inflection point, catching markets in transition between the post-summer rally and the year-end performance chase.
The 10/10/2025 selloff fits this historical script. Following a year of persistent gains fueled by mega-cap technology stocks and AI-related enthusiasm, the market had become technically extended, with sentiment indicators pushing into optimistic extremes. A catalyst was needed — and when it came, the downside reaction was swift.
Technical Deterioration Preceded the Drop
From a technical perspective, cracks had been forming well before the October 10 plunge:
- Breadth Divergence: While the S&P 500 reached marginal new highs in late September, fewer than 60% of components were trading above their 50-day moving averages, and participation had been declining since mid-August. This narrowing leadership mirrored patterns seen in late-stage bull runs, most notably 1998–1999 and mid-2021.
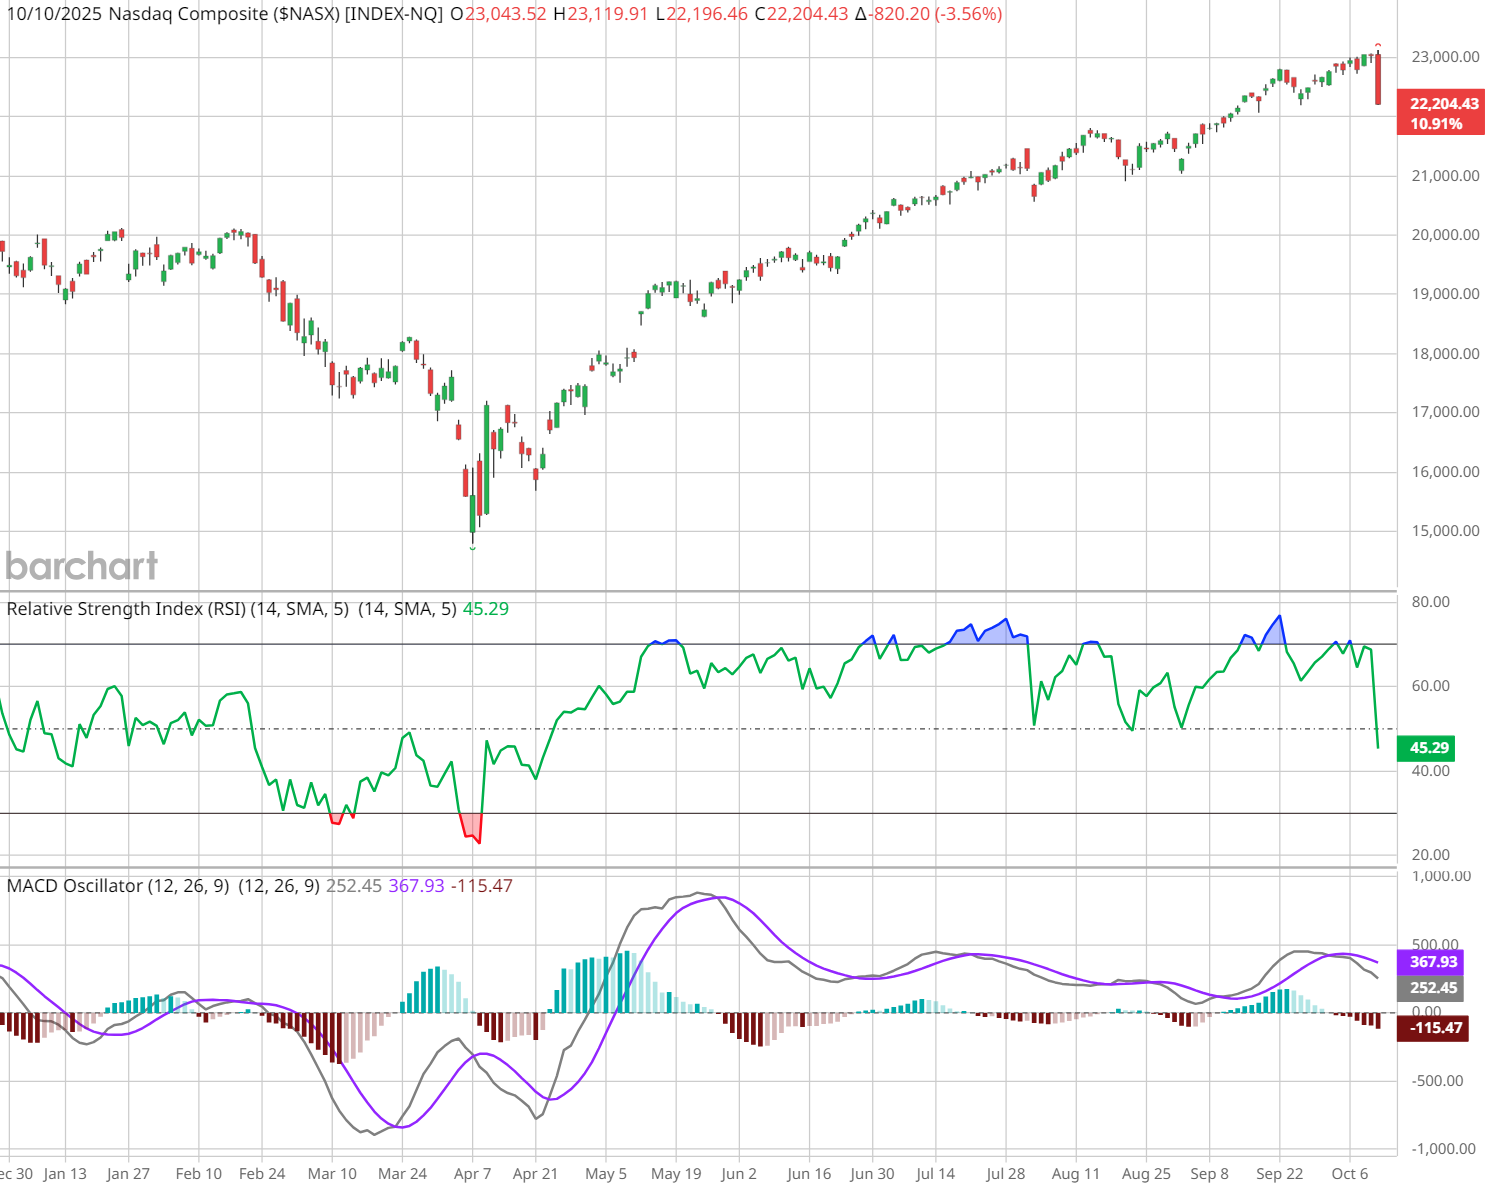
- Momentum Rollovers: RSI readings on market leaders had slipped from overbought conditions in August into lower highs, signaling waning upside momentum. The MACD histogram turned negative on the Nasdaq Composite in September and never regained its prior highs.
- Failed Breakouts: Several leading growth names — particularly in the AI, semiconductor, and cloud subsectors — failed to hold breakout levels, triggering technical weakness and algorithmic selling.
Although not predictive of exact timing, these signals often precede market air pockets when sentiment shifts suddenly.
Catalysts and the Domino Effect
Layered on top of growing political uncertainty over government funding and trade policy was a market priced at historically elevated valuations. The Buffett Indicator hovered well above its long-term average, the Shiller CAPE reached levels last seen during the late 1990s tech bubble, and multiple sentiment gauges reflected extreme optimism.
Once key technical levels broke, systematic and algorithmic strategies accelerated selling, creating a cascade reminiscent of past liquidity air pockets like 2015 and 2018. The result was a feedback loop similar to the recent “China DeepSeek devaluation” flash decline.
Behavioral Finance Under the Surface
Investor behavior played a pivotal role, as it often does during sharp corrections:
- Recency Bias led many to extrapolate the steady uptrend of 2025 into the future, discounting risk. After months of low volatility and narrow leadership gains, the sudden reversal was psychologically jarring, amplifying panic selling.
- Ninety Percent Downside Days, as defined by Paul Desmond of Lowry Research, occur when 90% or more of total volume is in declining stocks. October 10 qualified, with downside volume exceeding 92%. Historically, clusters of these days have marked either early bear market phases or capitulation washouts that precede rebounds.
- 9-to-1 Down Volume Days, a concept popularized by Ned Davis Research, similarly signal intense selling pressure. Their historical studies show that markets often produce above-average forward returns 3–6 months after such days — provided these events occur within uptrends or as singular panic events, not during protracted bear markets.
The violence of October 10’s downside volume may ultimately prove constructive, flushing out weak hands and resetting sentiment — but only if follow-through selling doesn’t convert this into a broader downtrend.
Financial Stress and the Anatomy of a Bubble
James Montier’s “Anatomy of a Bubble” and his “Practitioner’s Guide to Applying Behavioral Finance” argue that bubbles don’t simply deflate; they pop suddenly, typically when some form of financial distress emerges. Historically, this has included credit events, policy shocks, or macro uncertainty that expose speculative excess.
The current backdrop features multiple sources of stress that, while not catastrophic individually, collectively create a fragile environment:
- Government Shutdown Uncertainty – Political gridlock has raised questions about funding deadlines, echoing volatility spikes during episodes like the 2011 debt ceiling crisis.
- Treasury Issuance and Debt Concerns – A surge in long-term issuance to fund deficits, combined with waning global appetite for U.S. debt, has forced markets to reassess risk valuations.
- Tariff and Trade Tensions – Renewed tariff threats between the U.S. and key partners added to global uncertainty.
- Currency Debasement Fears – Competitive devaluations and interventions have eroded confidence in several fiat currencies, prompting flight-to-quality flows.
- Rising Consumer Stress – Higher credit card delinquencies and softening discretionary spending highlight consumer strain, undermining one of the key pillars of 2025’s economic resilience.
Taken together, this is less a classic euphoric bubble burst than a market confronting multiple stress points simultaneously, with behavioral biases amplifying the adjustment.
Comparisons to Past Market Events
While some commentators draw parallels to October 1987, the current decline differs in key respects. Market structure today is far more liquidity-fragmented, and the prevalence of algorithmic trading can exaggerate intraday moves without the same fundamental underpinnings of panic seen in 1987.
A more apt comparison may be October 2014, when a sudden spike in Treasury yields triggered a sharp, but ultimately contained, correction before markets stabilized and rallied into year-end.
Key Technical Levels to Watch
For technicians, the focus now turns to support and retracement zones.
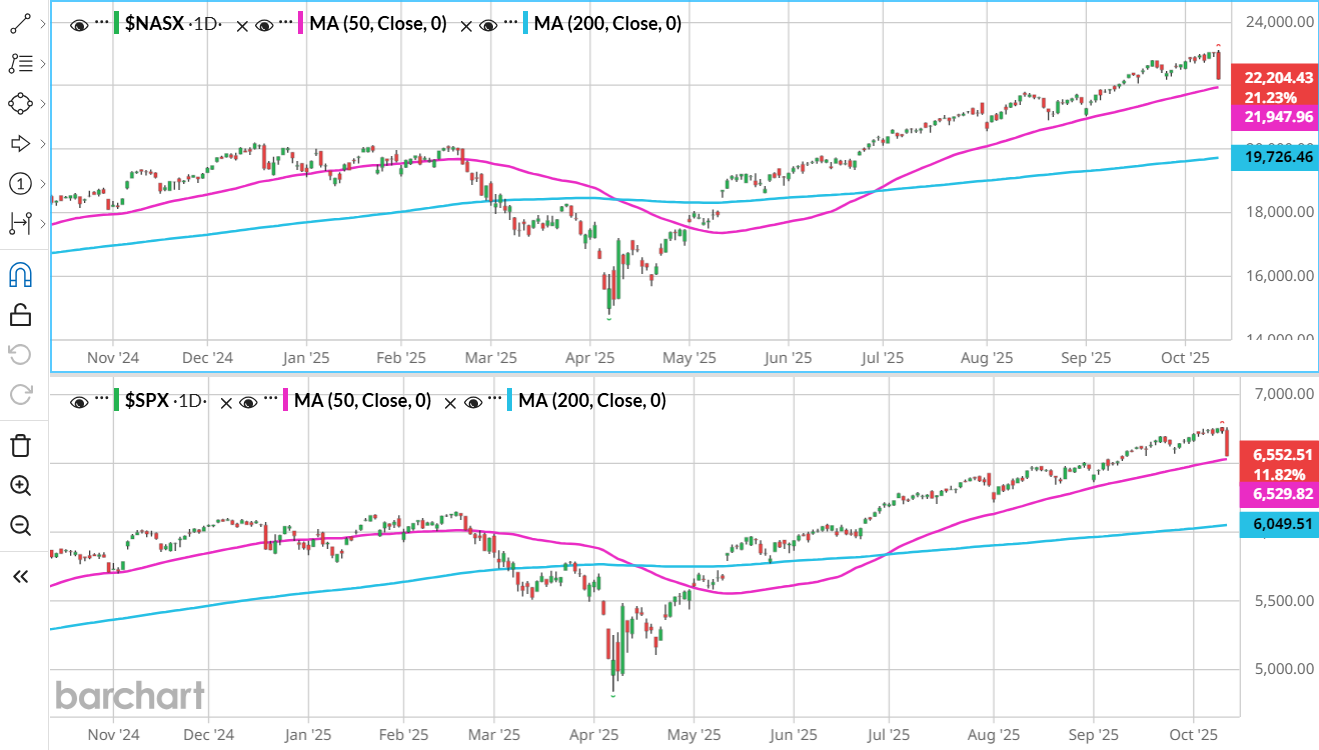
For the S&P 500, the 50-day moving average near 6,530 is the first line of defense. A decisive break below that would shift focus toward the 200-day moving average around 6,050, a level that often separates short-term corrections from deeper trend changes.
For the Nasdaq Composite, the 50-day sits near 21,796, while the 200-day rests around 19,726 — historically significant pivots during periods of heightened volatility.
Meanwhile, the Cboe Volatility Index ($VIX) registered a sharp spike above 20, reaching an intraday high of 24. Such volatility surges often mark short-term panic, but whether this proves to be a washout low or the start of a broader risk-off regime will hinge on how quickly volatility compresses and whether buying interest re-emerges near these support zones.
Conclusion: A Correction, Not Yet a Crisis
While dramatic, the October 10, 2025, decline is not unprecedented. Markets that rise on narrow leadership and stretched valuations are inherently vulnerable to air pockets. The technical deterioration had been evident, even if underappreciated. Historically, such corrections often serve as cleansing mechanisms, broadening leadership and resetting expectations.
The coming weeks will reveal whether this was a one-day panic or the start of a deeper correction. For now, technicians should focus on follow-through selling, breadth improvement, and price behavior around key moving averages to gauge the market’s next move.
– John Rowland, CMT, is Barchart’s Senior Market Strategist and host of Market on Close.