
It’s not easy plying one’s trade in the broader hydrocarbon energy industry — even with the Trump administration’s tacit support for the sector. Just look at natural gas and natural gas liquids (NGL) specialist Oneok (OKE). Despite delivering solid financial results and enjoying political relevance, Oneok can’t quite get it together in the equities arena. Still, the ugliness in the charts for OKE stock could spell opportunity for intrepid speculators.
Earlier this month, the Tulsa, Oklahoma-based energy company posted second-quarter net income of $841 million, per Barchart content partner AP. On a per-share basis, Oneok delivered earnings of $1.34, matching the consensus estimate by Wall Street analysts. Further, the natural gas specialist generated revenue of $7.89 billion in the period.
Despite the solid results, OKE stock has struggled. Since the disclosure, shares are down 8.5%. Plus, it’s difficult to ignore that visually, the fallout is unsightly. Since the beginning of the year, OKE has declined by more than 27%.
Not surprisingly, OKE stock represented one of the highlights in Barchart’s Unusual Stock Options Volume screener. This data interface showcases the top 500 securities that have generated aberrant transactions relative to prior norms in the derivatives market. Theoretically, the screener can tip off retail investors as to where the smart money may be positioning its funds.
On Monday, total options volume for OKE stock reached 4,924 contracts, representing a 54.89% lift over the trailing one-month average. Interestingly, call volume stood at 4,197 contracts, leaving the put side at only 727 contracts. On paper, this would seem bullish as it implies more traders buying calls than puts.
However, options can be debit or credit based, imposing complexities. A closer look at options flow — which focuses exclusively on big block transactions — showed net trade sentiment slightly favoring the bears. However, last Friday, this metric stood at $136,700 above parity, overwhelmingly favoring the bullish side.
While it’s difficult to make wholesale assumptions, it appears that professional investors don’t anticipate OKE stock falling below the $75 strike price by the Sep. 19 expiration date.
Using Path Dependency to Estimate Where OKE Stock May End Up
While analyzing unusual options activity can be helpful, it’s not the full story. To be quite honest, I’m not sure if there are empirical studies linking the insights of unusual options with predictive power — and that’s probably because such studies are inherently multidimensional. To get a clearer picture of the unknown future, traders may rely on one of two frameworks.
Primarily, the most common approach is known as volatility dependency. By using derivations of the Black-Scholes formula, retail traders rely on implied volatility (IV) to narrow down their range of possibilities for their target security. Essentially, a higher IV ratings lead to wider bands in projections such as the Expected Move calculator, while lower IV ratings lead to narrower bands.
However, one of the biggest concerns that I have about Black-Scholes-derived or influenced metrics is that the formula doesn’t account for how markets actually behave. For example, returns are assumed to be log-normal distributions rather than fat-tailed, skewed and clustered around pockets of volatility. There’s also the obvious vulnerability that it doesn’t account for American-style options, which allow for position exiting prior to expiration.
While I might get skewered for saying this, I believe a better approach is path dependency. Much more common in Slavic countries, path dependency builds forecasts off actual pricing dynamics against like-like conditions. In other words, the math involved in this approach is descriptive rather than prescriptive.
However, the tricky part of path-dependent models is that the input and output variables require epistemological continuity. As such, I convert price action into a binary code of accumulative and distributive sessions. With this approach, all stocks now speak the same language — facilitating cross-sector analysis.
For OKE stock, the takeaway is that in the past 10 weeks, the market voted to buy the security four times and sell six times. During this period, OKE incurred a downward trajectory. For brevity, we can label this sequence as 4-6-D.
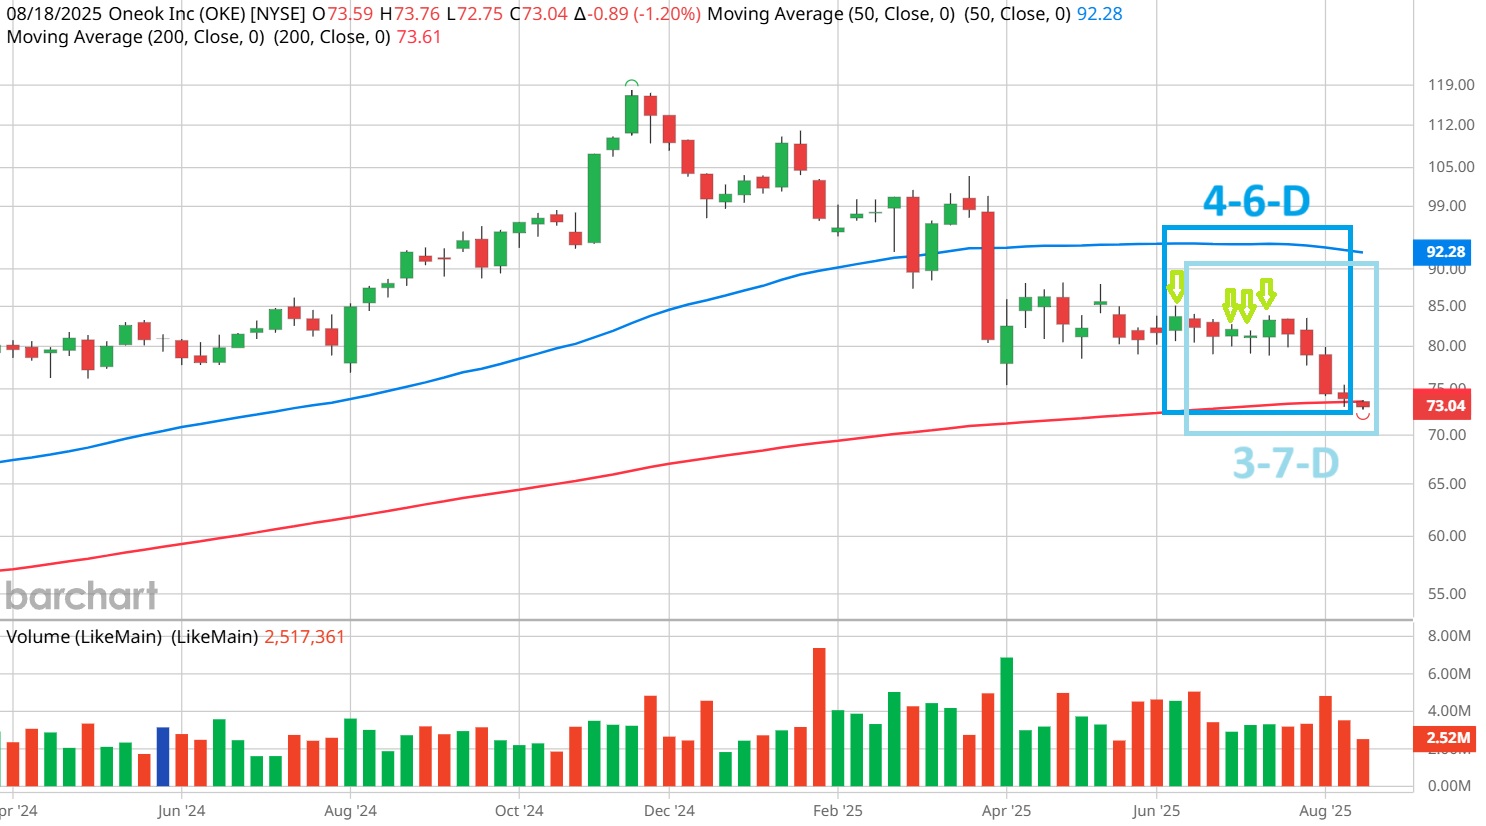
Notably, in 68% of cases (going back to January 2019), the following week’s price action results in upside, with a median return of 2.32%. That’s above the baseline probability of 57.23% or the chance that a long position will be profitable on any given week.
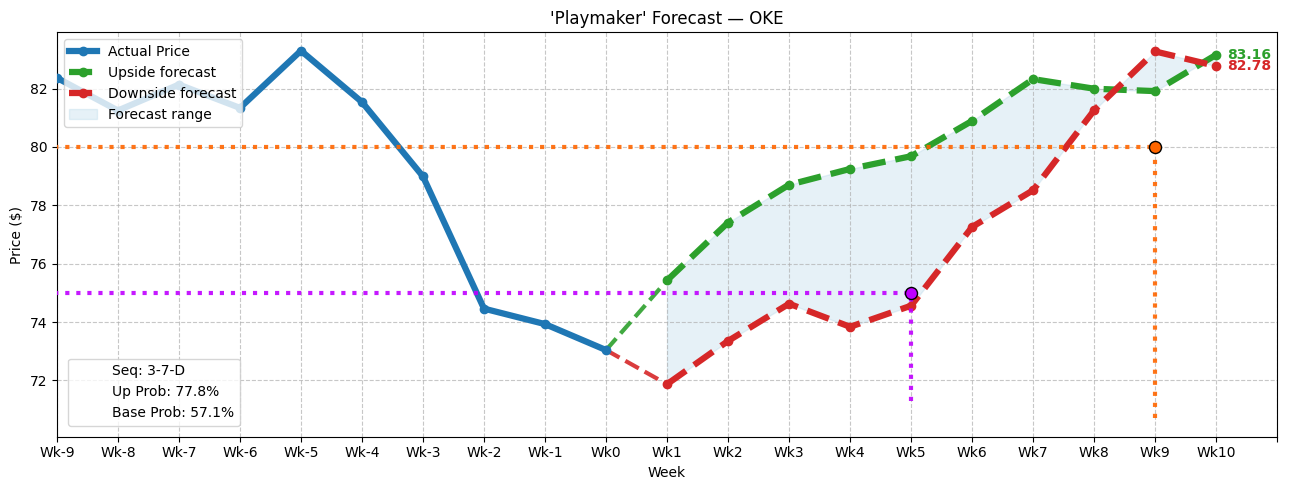
Adding to the intrigue, if we were to include the current week’s session into the equation, OKE stock would be charting a 3-7-D sequence. This rare signal has an even greater next-week upside probability of 77.8%.
Intriguing Strategies to Consider
Based on how the next 10 weeks could play out as implied by the flashing of the 3-7-D sequence (which is very similar to the scenario forecasted by the 4-6-D sequence), the most conservative debit-based multi-leg options strategy may be the 70/75 bull call spread expiring Sep. 19. This trade requires OKE stock to hit the $75 short strike price at expiration, which appears to be more than doable (assuming that you believe my forecast).
However, the payout — for a net debit of $325 — is just under 54%. That’s not particularly enticing.
A much more tempting trade is the 75/80 bull call spread expiring Oct. 17. The $80 short strike price is projected in my model to be lower than either the positive or negative pathways. Of course, you would have to assume that my projections are more accurate than volatility-dependent calculations. With a payout of over 170%, it’s going to tempt some folks.
Now, the real [insert Samuel L. Jackson’s favorite word here] is the 75/80 bull spread expiring Sep. 19. My model shows that it’s on the edge of possibility. If you’re a believer, you need to put down $130 for the chance to gain a profit of $370. That’s a payout of almost 285%.
Yeah, there’s a lot to think about when you shift paradigms to path dependency.
On the date of publication, Josh Enomoto did not have (either directly or indirectly) positions in any of the securities mentioned in this article. All information and data in this article is solely for informational purposes. For more information please view the Barchart Disclosure Policy here.