Apple, Inc (NASDAQ:AAPL) opened the trading session on Thursday mostly flat after consolidating on Wednesday and then fell about 1% lower within the first half-hour of trading.
On Wednesday, Market Rebellion co-founder Jon Najarian said on CNBC he added to his position in Apple, despite the tech giant nearing a $3 trillion market cap. Najarian believes the stock is headed to $200.
Bank of America is also bullish on Apple due to strong demand for iPhones and lower trade-in prices for older models. BofA Analyst Wamsi Mohan has a Buy rating on Apple and a price target of $215.
Chart-wise, Apple appears to be headed for a blue-sky run after some further continued consolidation takes place on both the tech giant’s stock and the overall market, which has been running hot for about two weeks
See Also: Apple Vs. Microsoft: A Race To New All-Time Highs
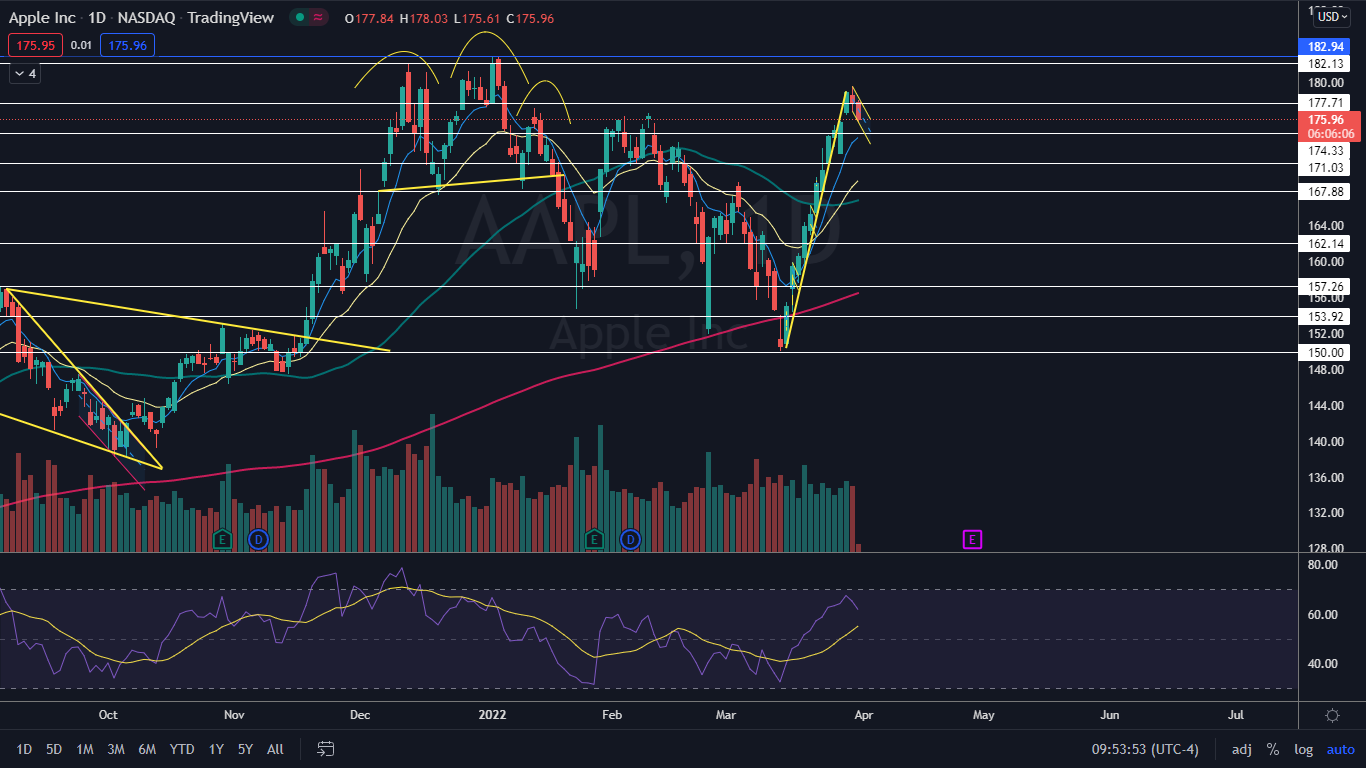
The Apple Chart: Apple reversed to the upside on March 15 but didn’t confirm a daily uptrend until Monday, when the stock printed its first higher low after soaring up 16%. Apple then pulled back about 1.5% lower to print the higher low before rising up another 4.3% between March 28 and Wednesday.
On Wednesday, Apple almost printed an inside bar pattern on the daily chart, although the stock briefly rose above Tuesday’s high-of-day. On Thursday, Apple broke down bearishly from the pattern.
If Apple continues to consolidate lower but holds above the eight-day exponential moving average, it may settle into a bull flag pattern on the daily chart. If this happens and the pattern is recognized, the measured move is about 19%, which indicates Apple could trade up toward the $211 mark.
Continued consolidation is likely to come because Apple’s relative strength index (RSI) is measuring in at about 62%. When a stock’s RSI nears or reaches the 70% level it becomes overbought, which can be a sell signal for technical traders. The consolidation from Tuesday’s high-of-day has already helped to drop the RSI down from 68%.
Apple is trading above the eight-day and 21-day exponential moving averages (EMAs), with the eight-day EMA trending above the 21-day, both of which are bullish indicators. The stock is extended from the eight-day EMA by almost 3%, however, and if the stock trades sideways for a longer period of time the eight-day will catch up and could help to guide Apple higher.
Want direct analysis? Find me in the BZ Pro lounge! Click here for a free trial.
- Bulls want to see sideways consolidation and then for big bullish volume to come in and push the stock up over the previous all-time high, which could induce a blue-sky run. The only resistance above in the form of price history is $182.94.
- Bears will want to watch for Apple to fall below the eight-day EMA, which will negate the bull flag pattern, or for the stock to form a bearish double top at the previous all-time high. Apple has support below at $177.71 and $174.33.