
In my Q2 2025 Barchart energy report, I highlighted that the U.S. natural gas futures market led the energy sector on the downside in Q2 2025, with a 16.1% decline. Meanwhile, the NYMEX natural gas futures were 4.87% lower over the first six months of 2025, closing Q2 at $3.456 per MMBtu. I concluded with the following:
Natural gas is a seasonal energy commodity that tends to peak as winter approaches. Seasonality could support higher natural gas prices in the late third quarter and fourth quarter of 2025.
Don’t Miss a Day: From crude oil to coffee, sign up free for Barchart’s best-in-class commodity analysis.
Nearby NYMEX natural gas futures prices were lower in August 2025, trading near the $2.85 per MMBtu level.
A bearish trend in late summer
After trading at a high of nearly $4.20 per MMBtu on June 20, 2025, natural gas prices dropped by over 32%.
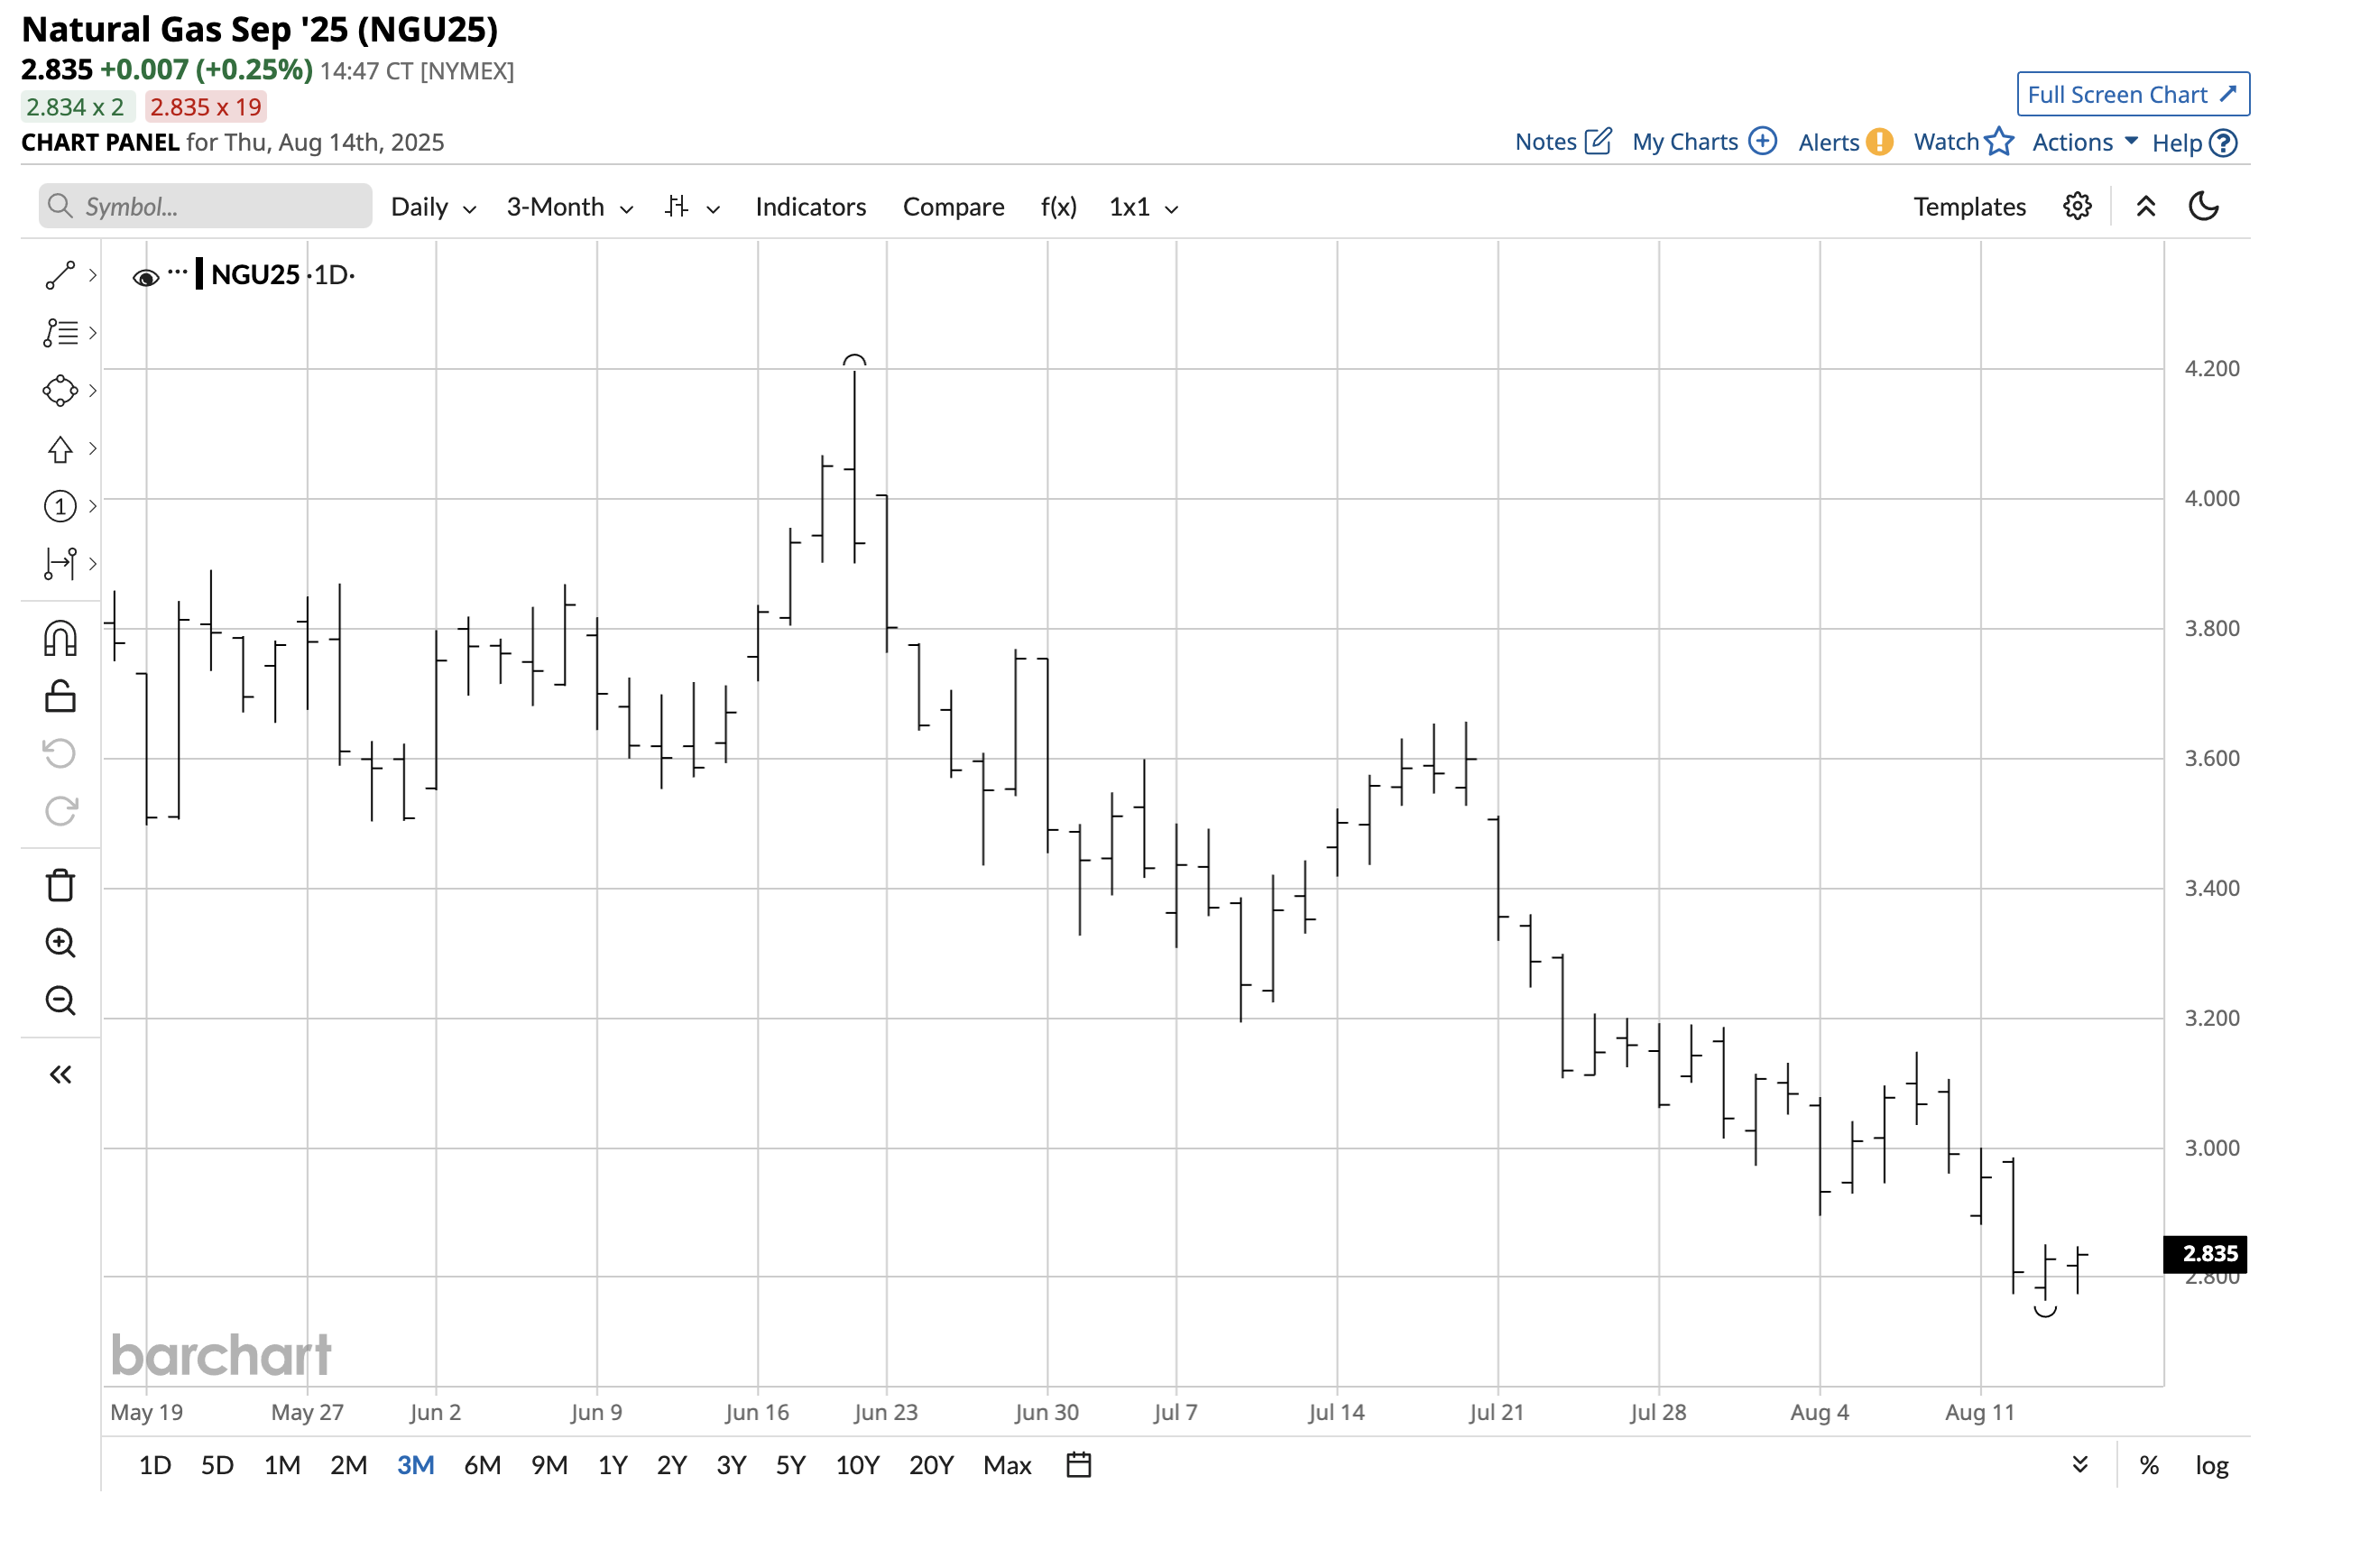
The daily chart of U.S. NYMEX natural gas futures for September delivery highlights the over 34% decline to the August 13 low of $2.764 per MMBtu. At around $3 per MMBtu in mid-August, the energy commodity was trading near the most recent low.
Inventories could mean a limited downside risk
Natural gas inventories across the United States remain below last year’s level.
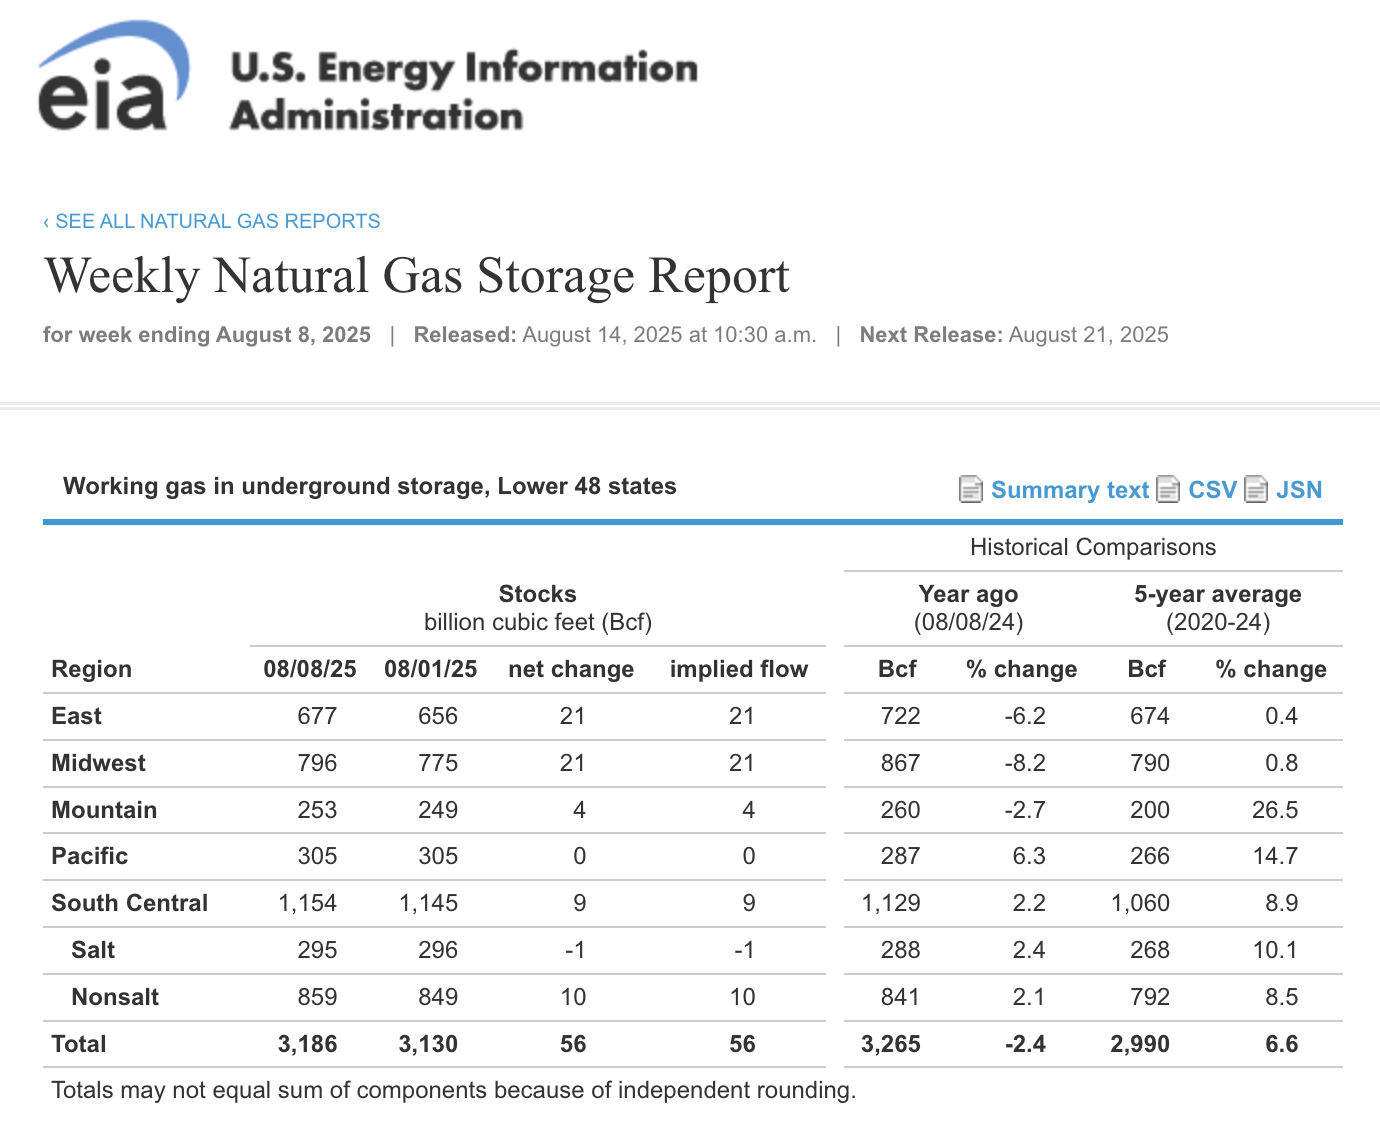
As of August 8, 2025, U.S. natural gas inventories at 3.186 trillion cubic feet stood at 2.4% below the level of the previous year, but 6.6% above the five-year average for early August.
The factors supporting natural gas prices for the upcoming peak season
The factors supporting natural gas prices as the peak demand season approaches over the coming months are:
- During the 2024/2025 peak season, the continuous NYMEX natural gas prices ranged from $2.514 to $4.908 per MMBtu, higher than the range during the 2023/2024 peak demand season, which was from $1.60 to $ 3.643 per MMBtu.
- Lower inventories going into the 2025/2026 peak season support higher prices and could limit the downside potential at the $3 level.
- U.S. LNG increasingly travels worldwide by ocean vessel to regions where prices are higher. Increased demand for U.S. LNG over the coming months could lead to declining inventories and rising prices.
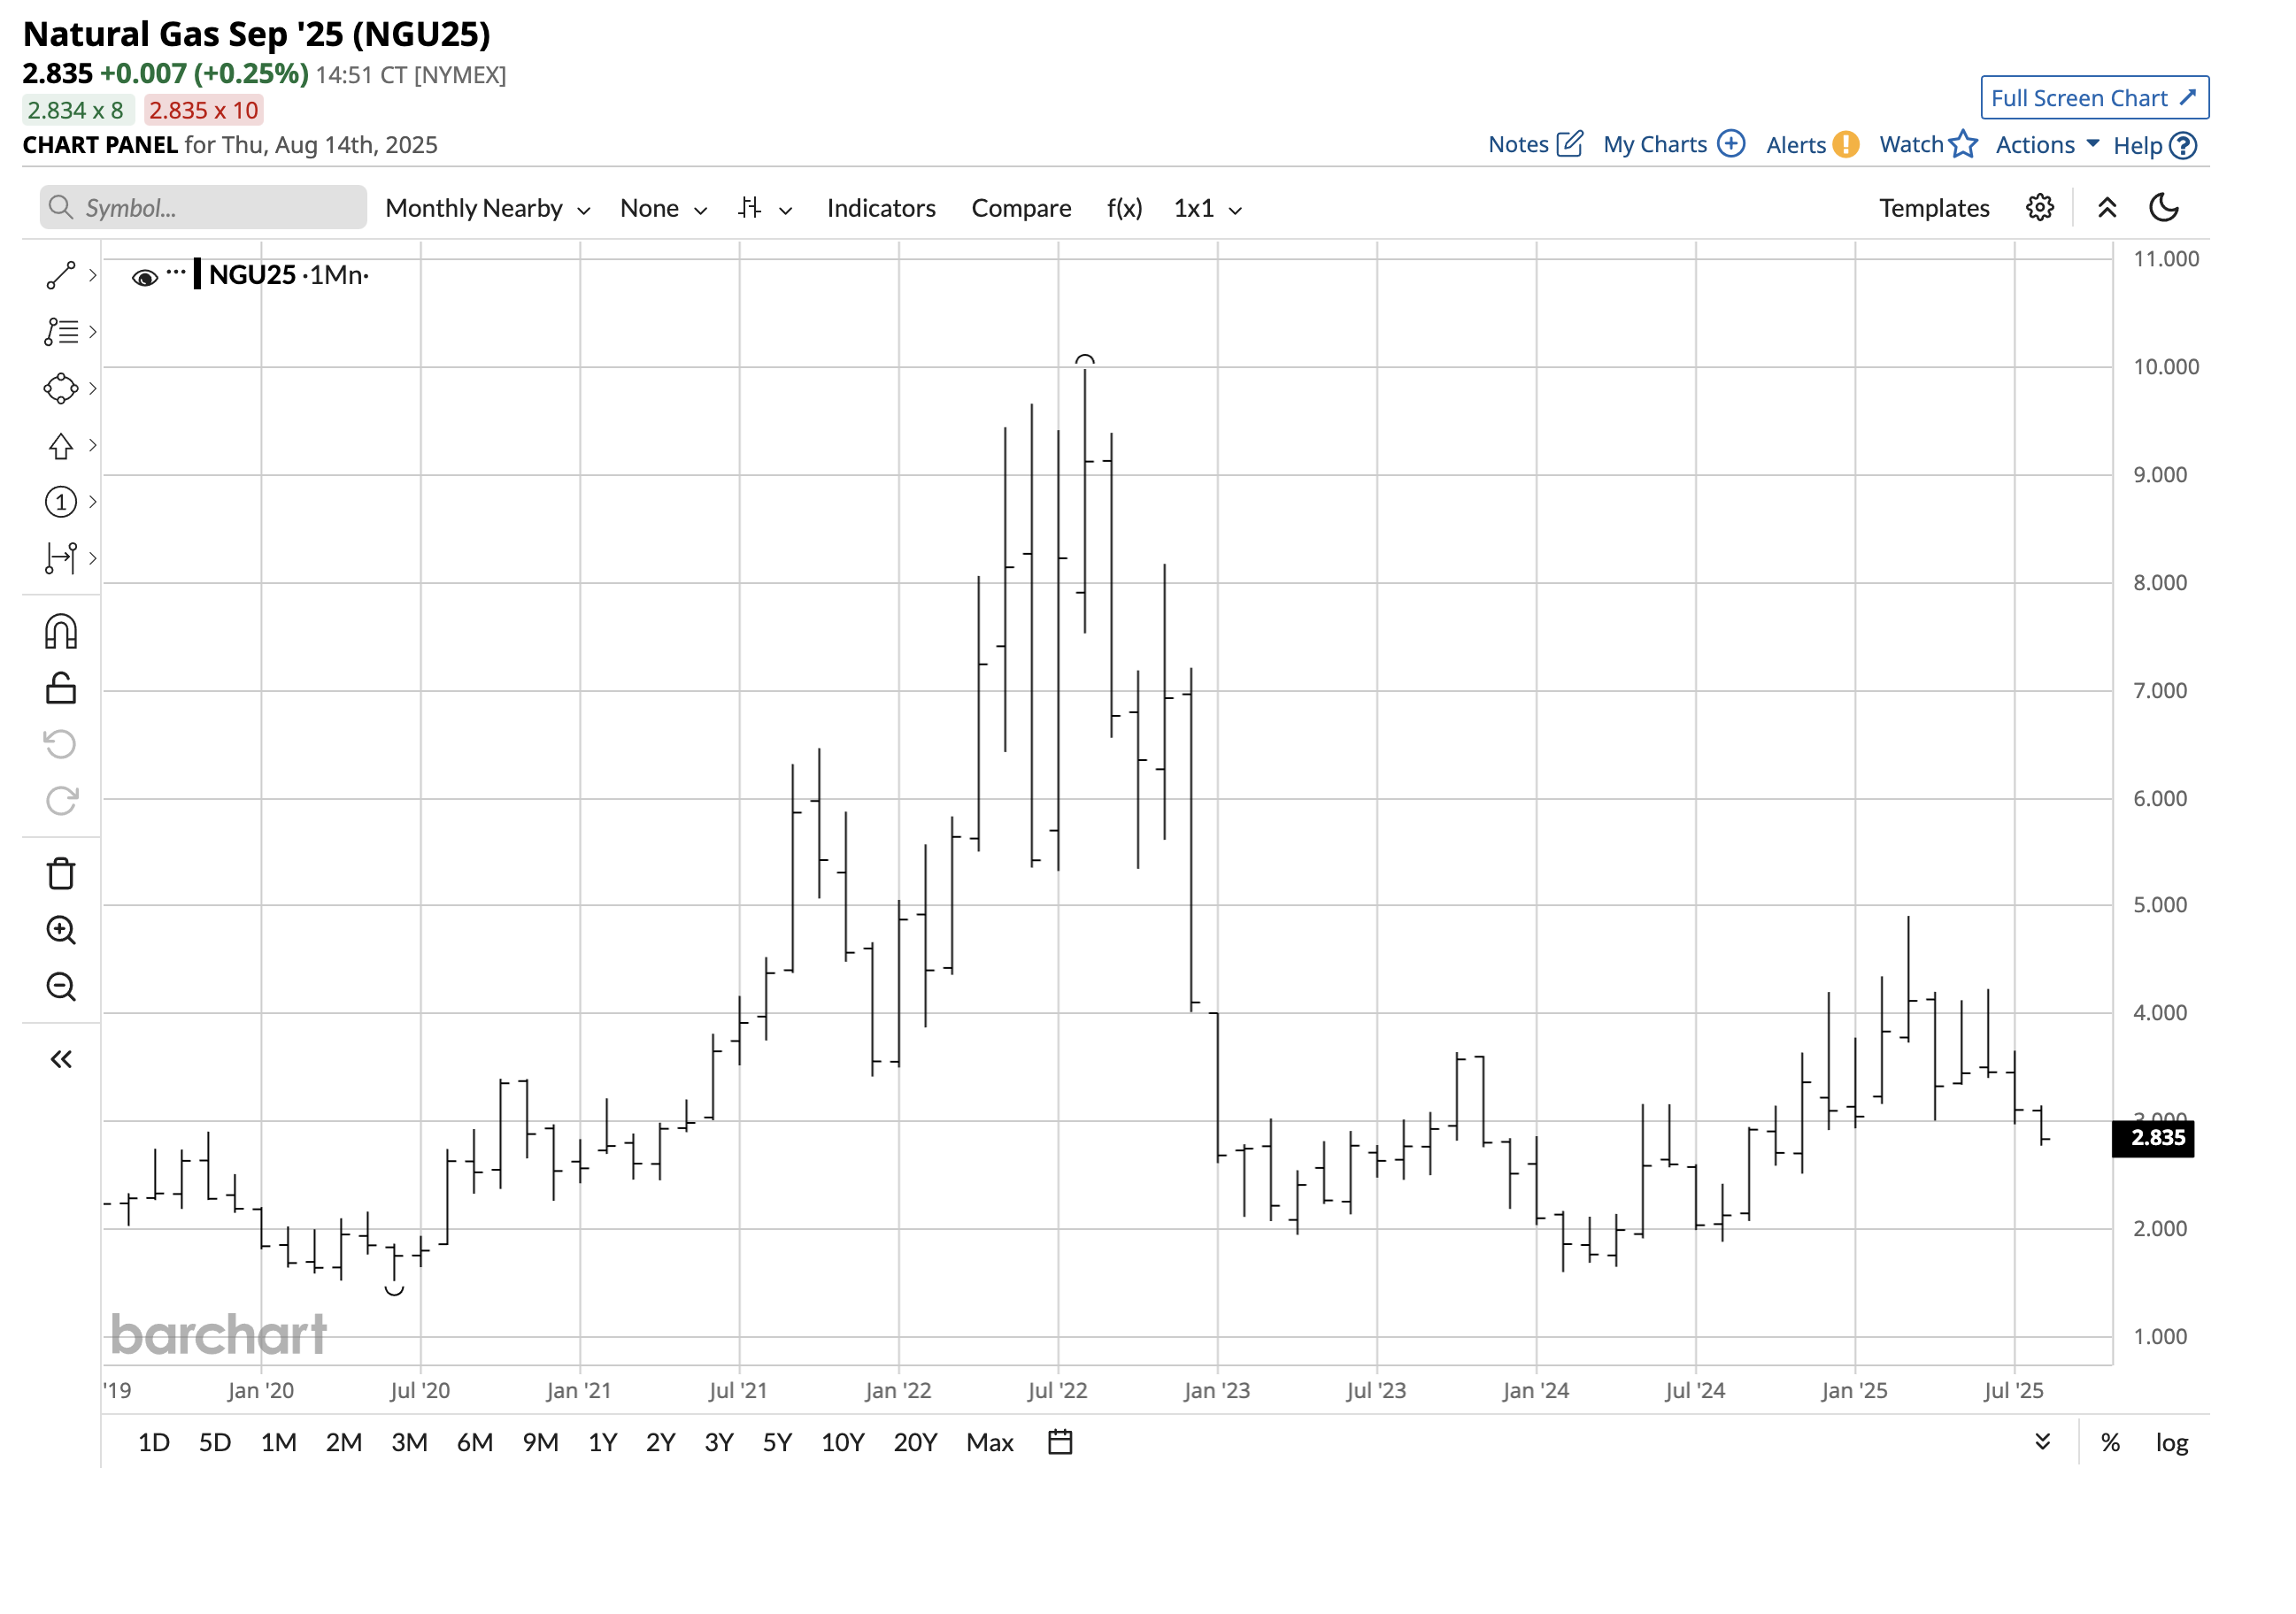
Meanwhile, the monthly continuous futures chart highlights that natural gas prices have trended higher since the February 2024 low of $1.60 per MMBtu.
UNG is the unleveraged natural gas ETF
The most direct route for a risk position in natural gas is the futures and futures options contracts on the CME’s NYMEX division. The United States Natural Gas Fund (UNG) is an unleveraged ETF tracking natural gas prices. At $12.51 per share, UNG had over $527 million in assets under management. UNG trades an average of over 9.9 million shares daily and charges a 1.11% management fee.
The most recent rally in September natural gas futures took the price 14.5% higher from a low of $3.193 on July 9, to a high of $3.657 on July 18.
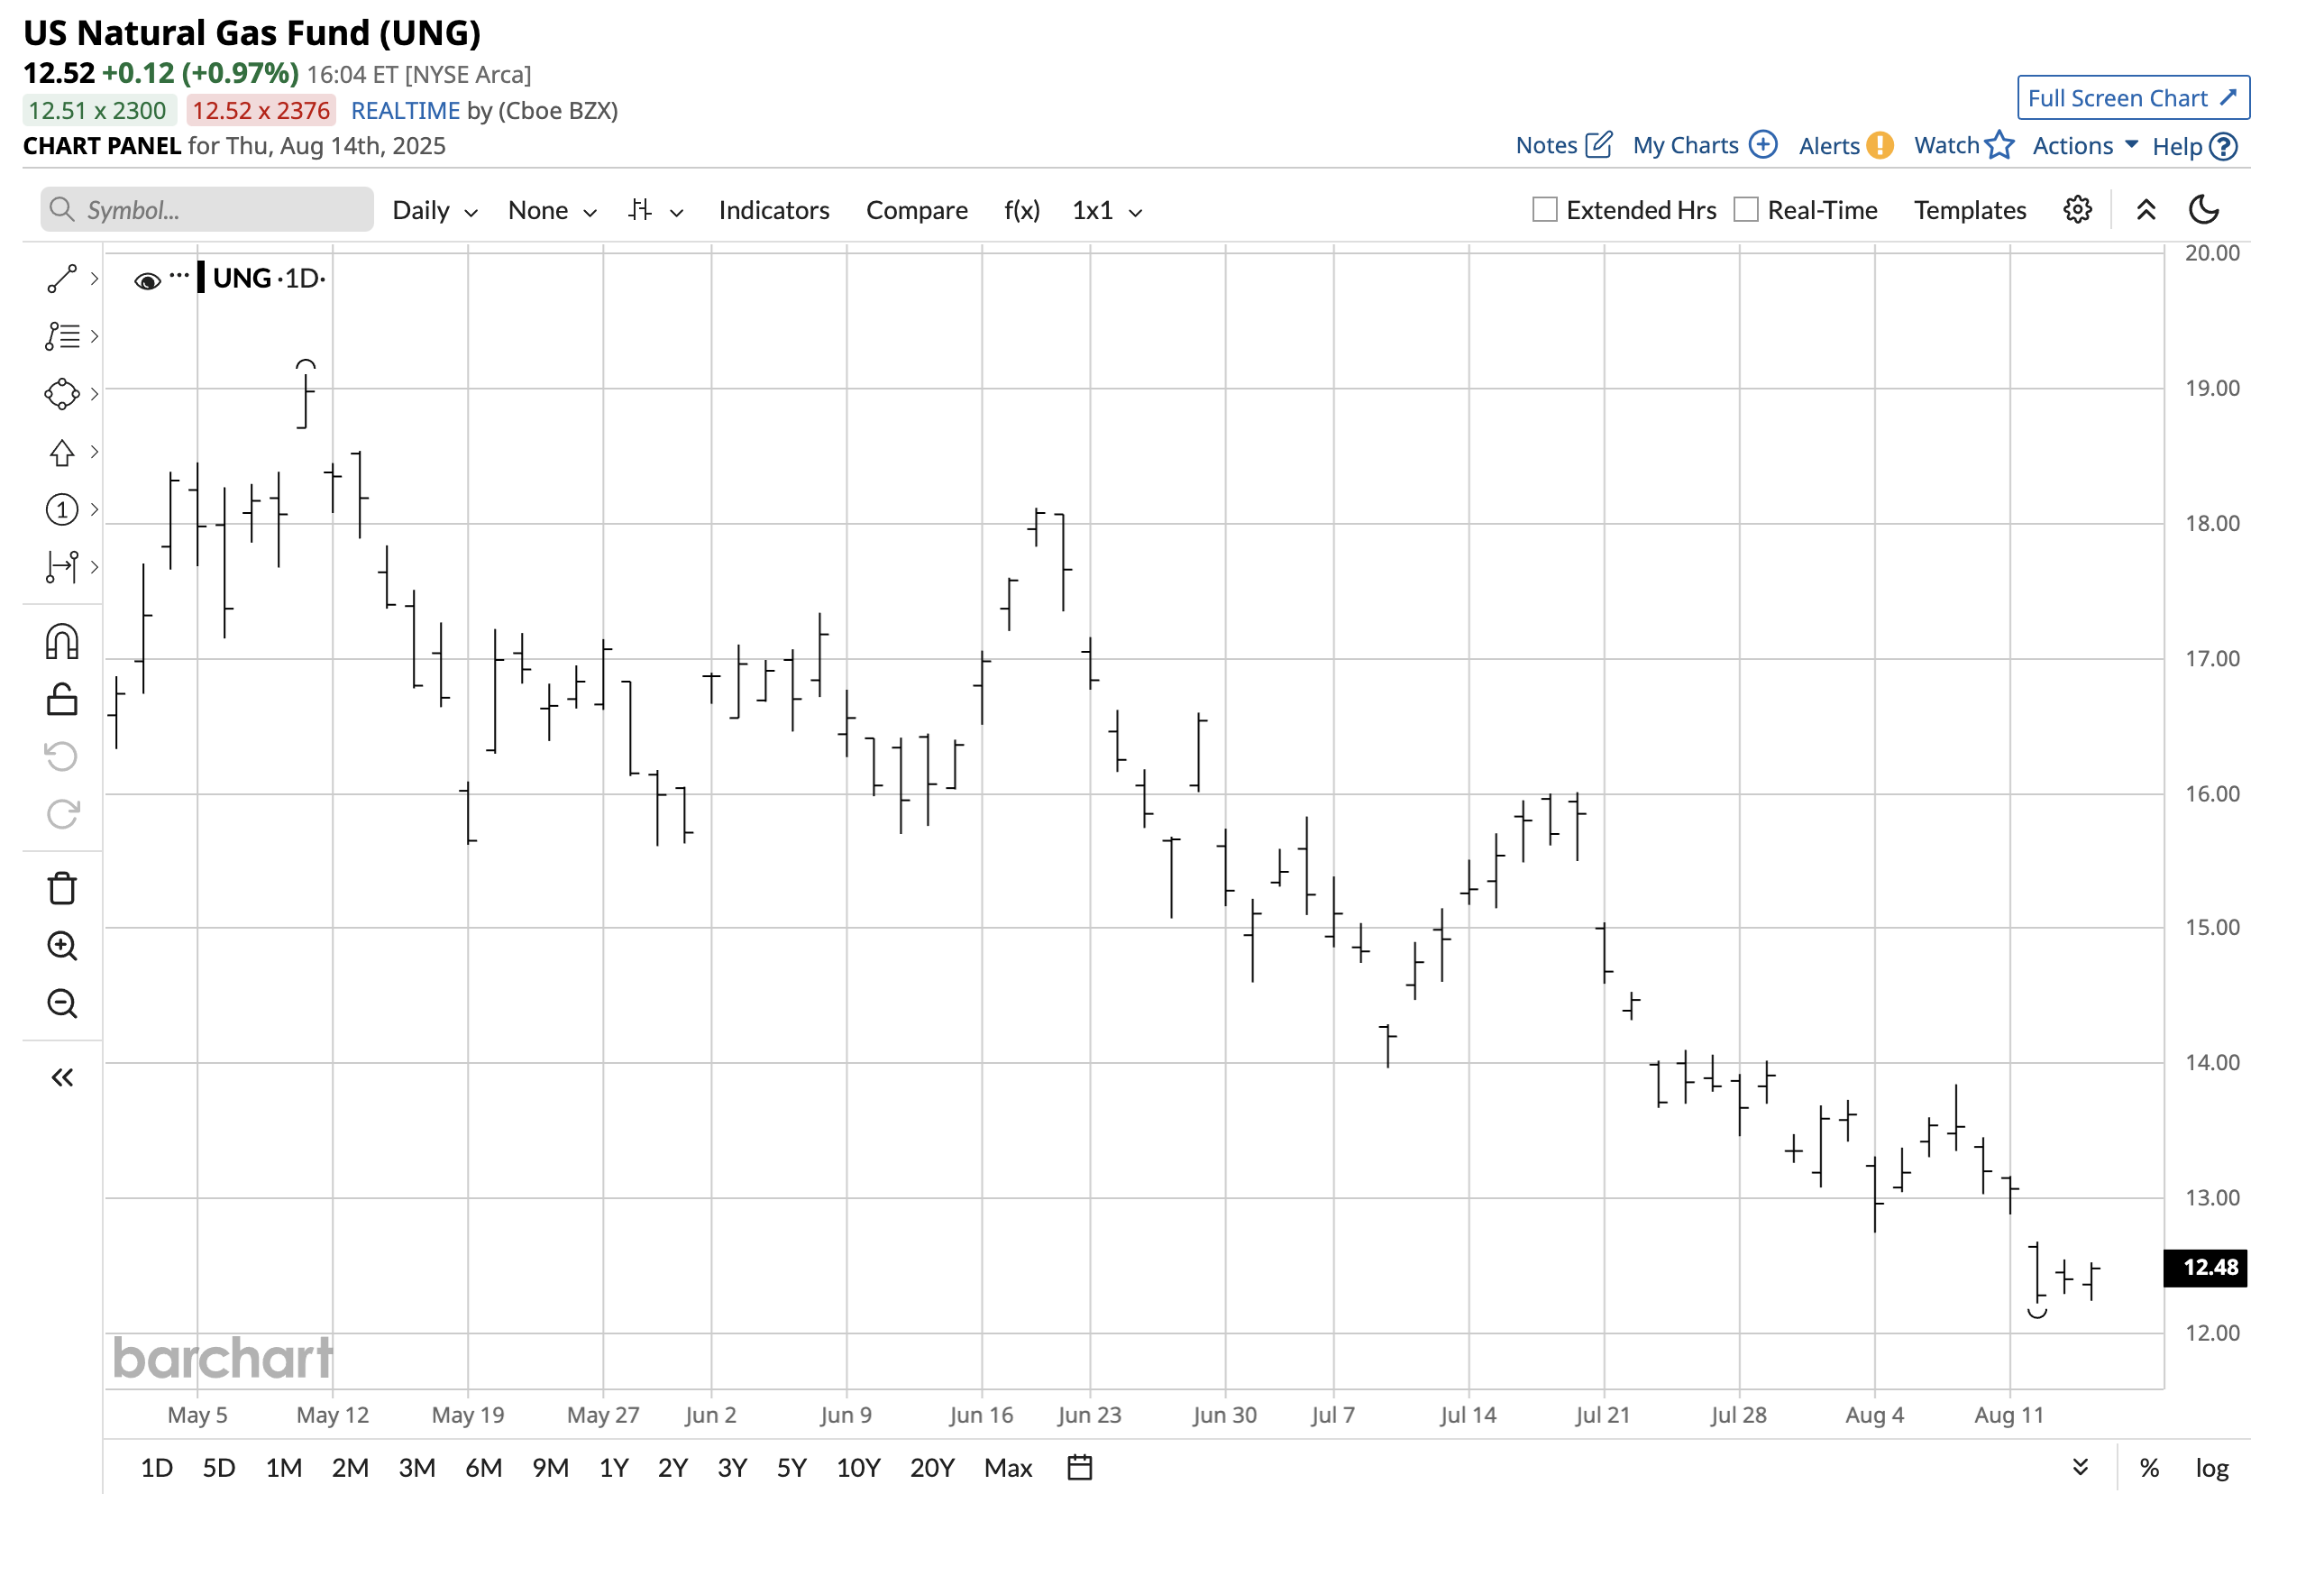
Over the same period, the UNG ETF rallied 14.7% from $13.96 to $16.01 per share, as UNG did an excellent job tracking the active month natural gas futures market.
BOIL and KOLD are UNG on steroids
The Bloomberg Ultra Natural Gas 2X ETF (BOIL) and the Bloomberg Ultrashort Natural Gas -2X ETF (KOLD) are twice-leveraged ETFs that turbocharge the natural gas futures’ price action on the up and downside, respectively.
At $29.88 per share, BOIL had nearly $655 million in assets under management. BOIL trades an average of over 5.369 million shares daily and charges a 0.95% management fee. While natural gas futures rose 14.5% and the UNG appreciated by 14.7% from the July 9 low to the July 18 high, BOIL turbocharged those results.
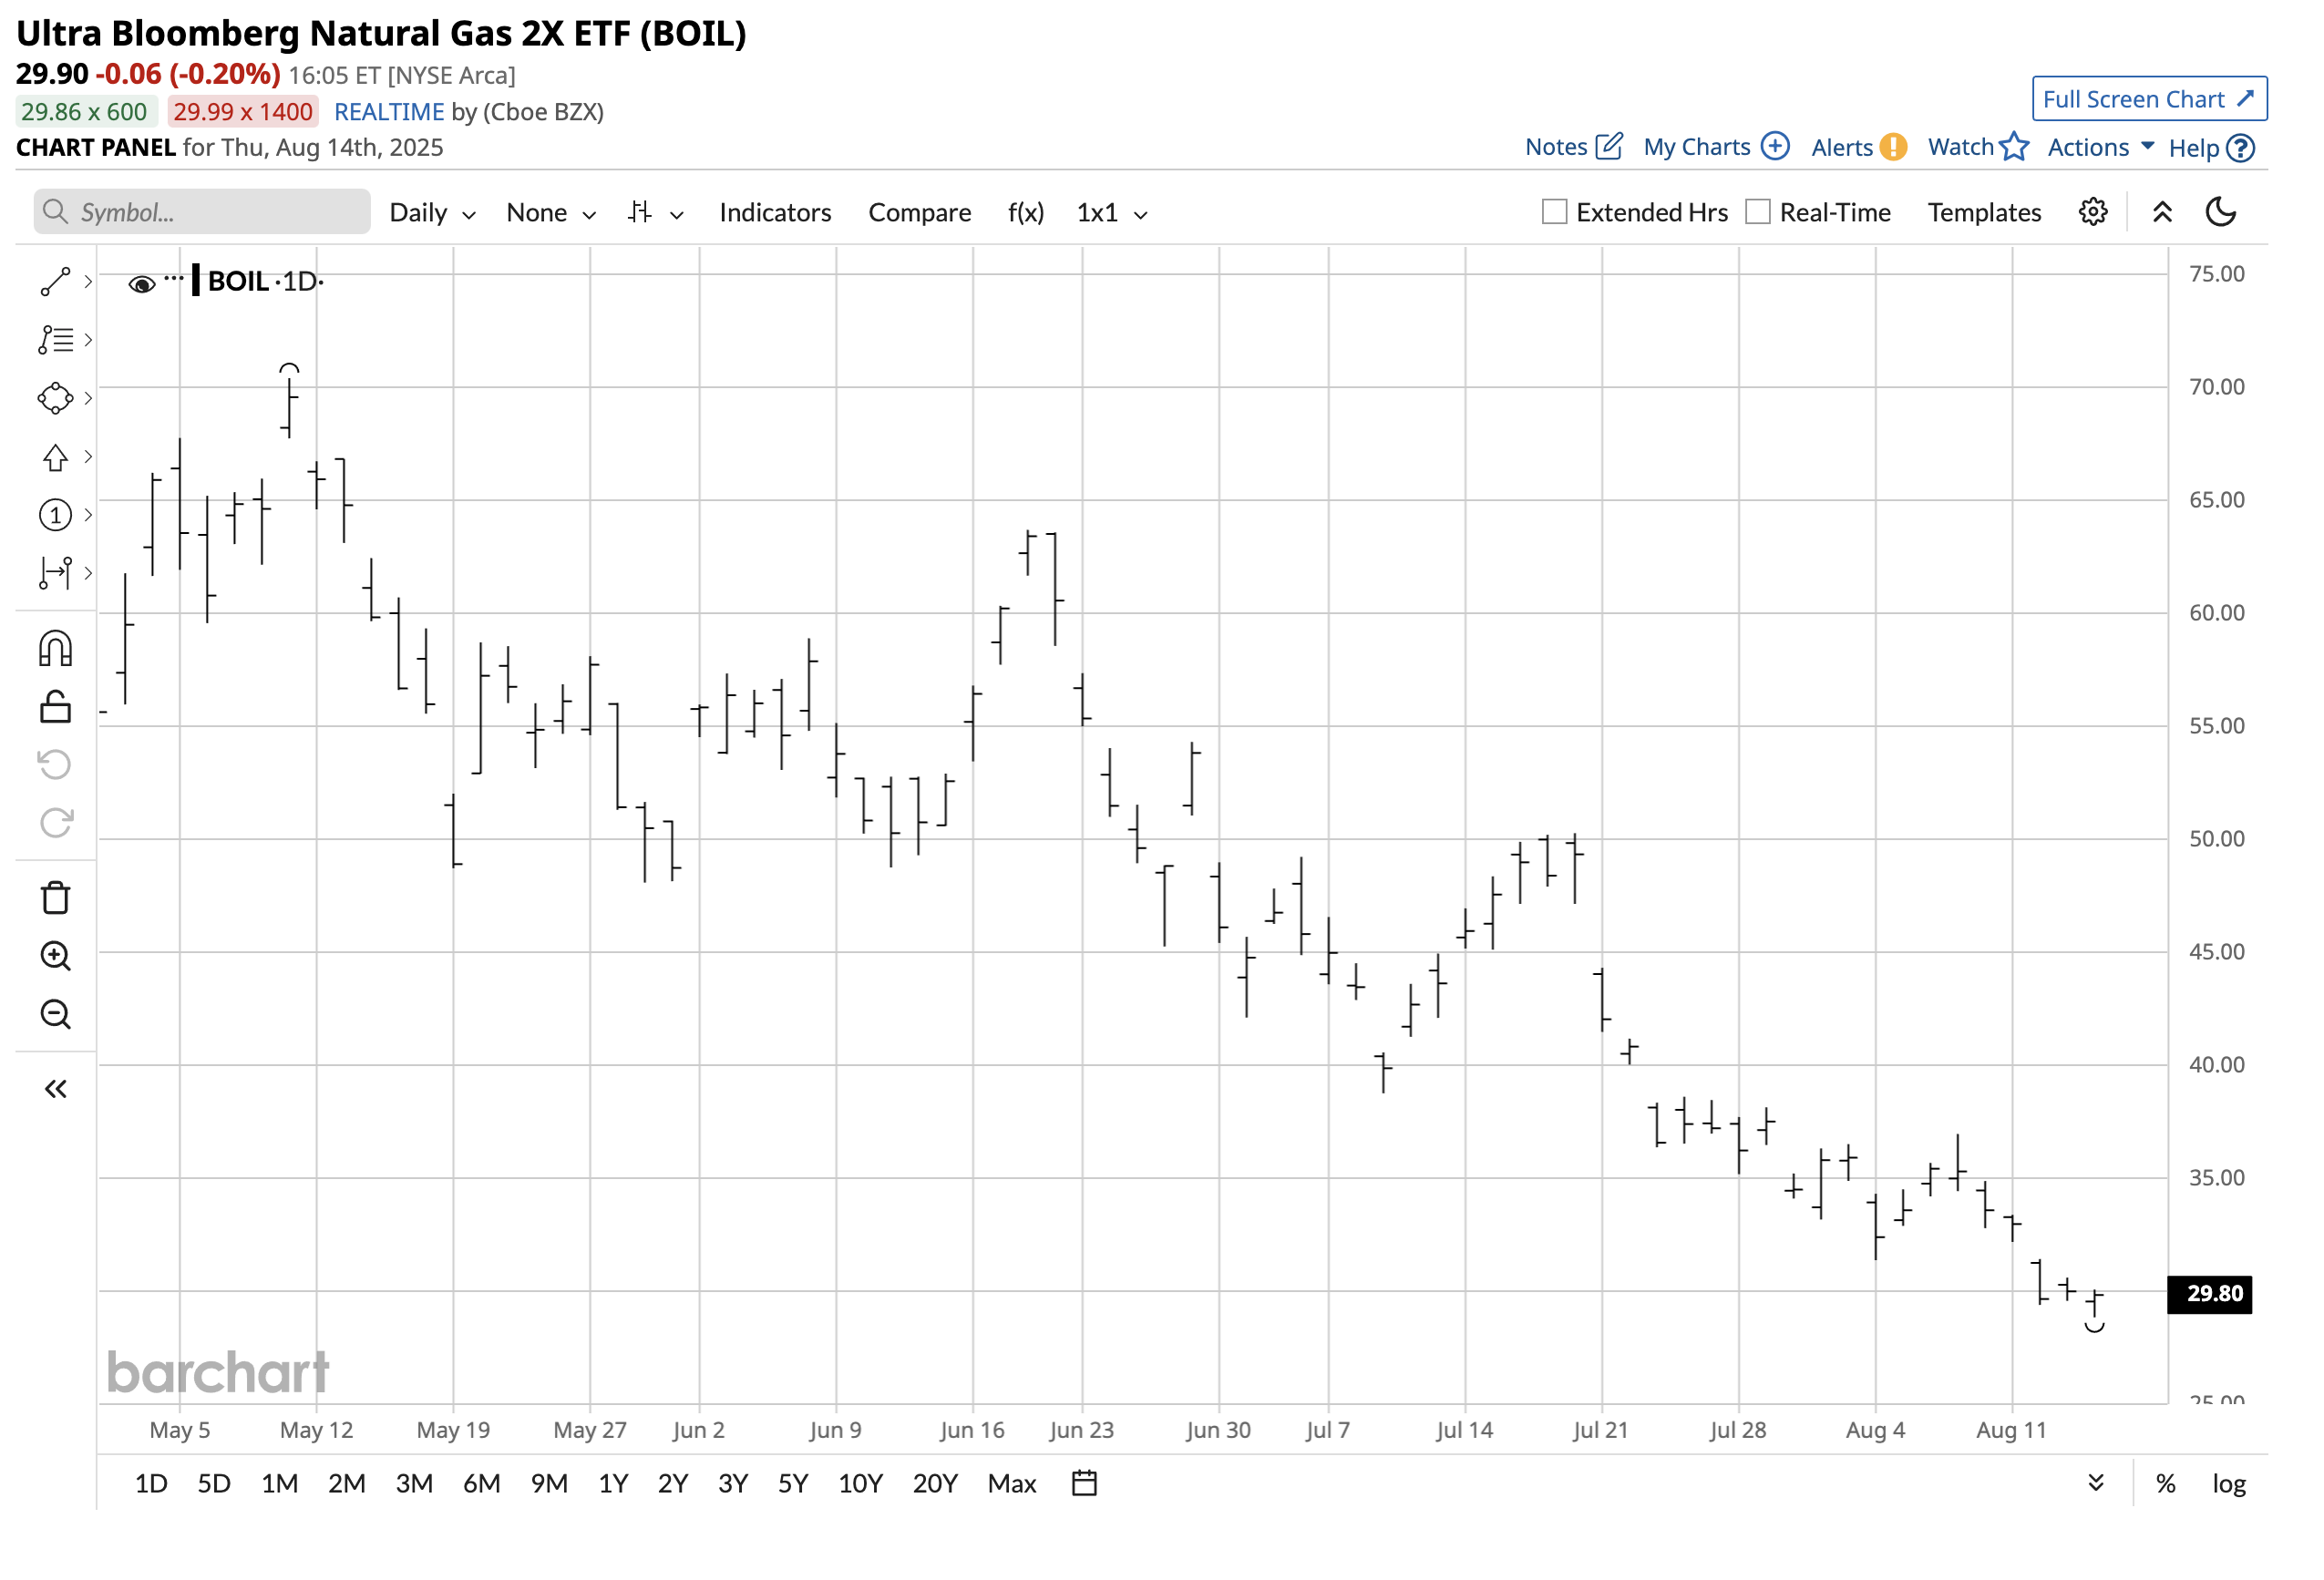
The chart shows the 29.74% rise from $38.73 to $50.25 per share from the July 9 low to the July 18 high.
At $36.09 per share, the bearish leveraged KOLD natural gas ETF had over $154 million in assets under management. KOLD trades an average of over 3.97 million shares daily and charges a 0.95% management fee. While September natural gas futures fell 24.4% from the July 18 high of $3.657 to the August 13 low of $2.764 per MMBtu, BOIL turbocharged those downside results.
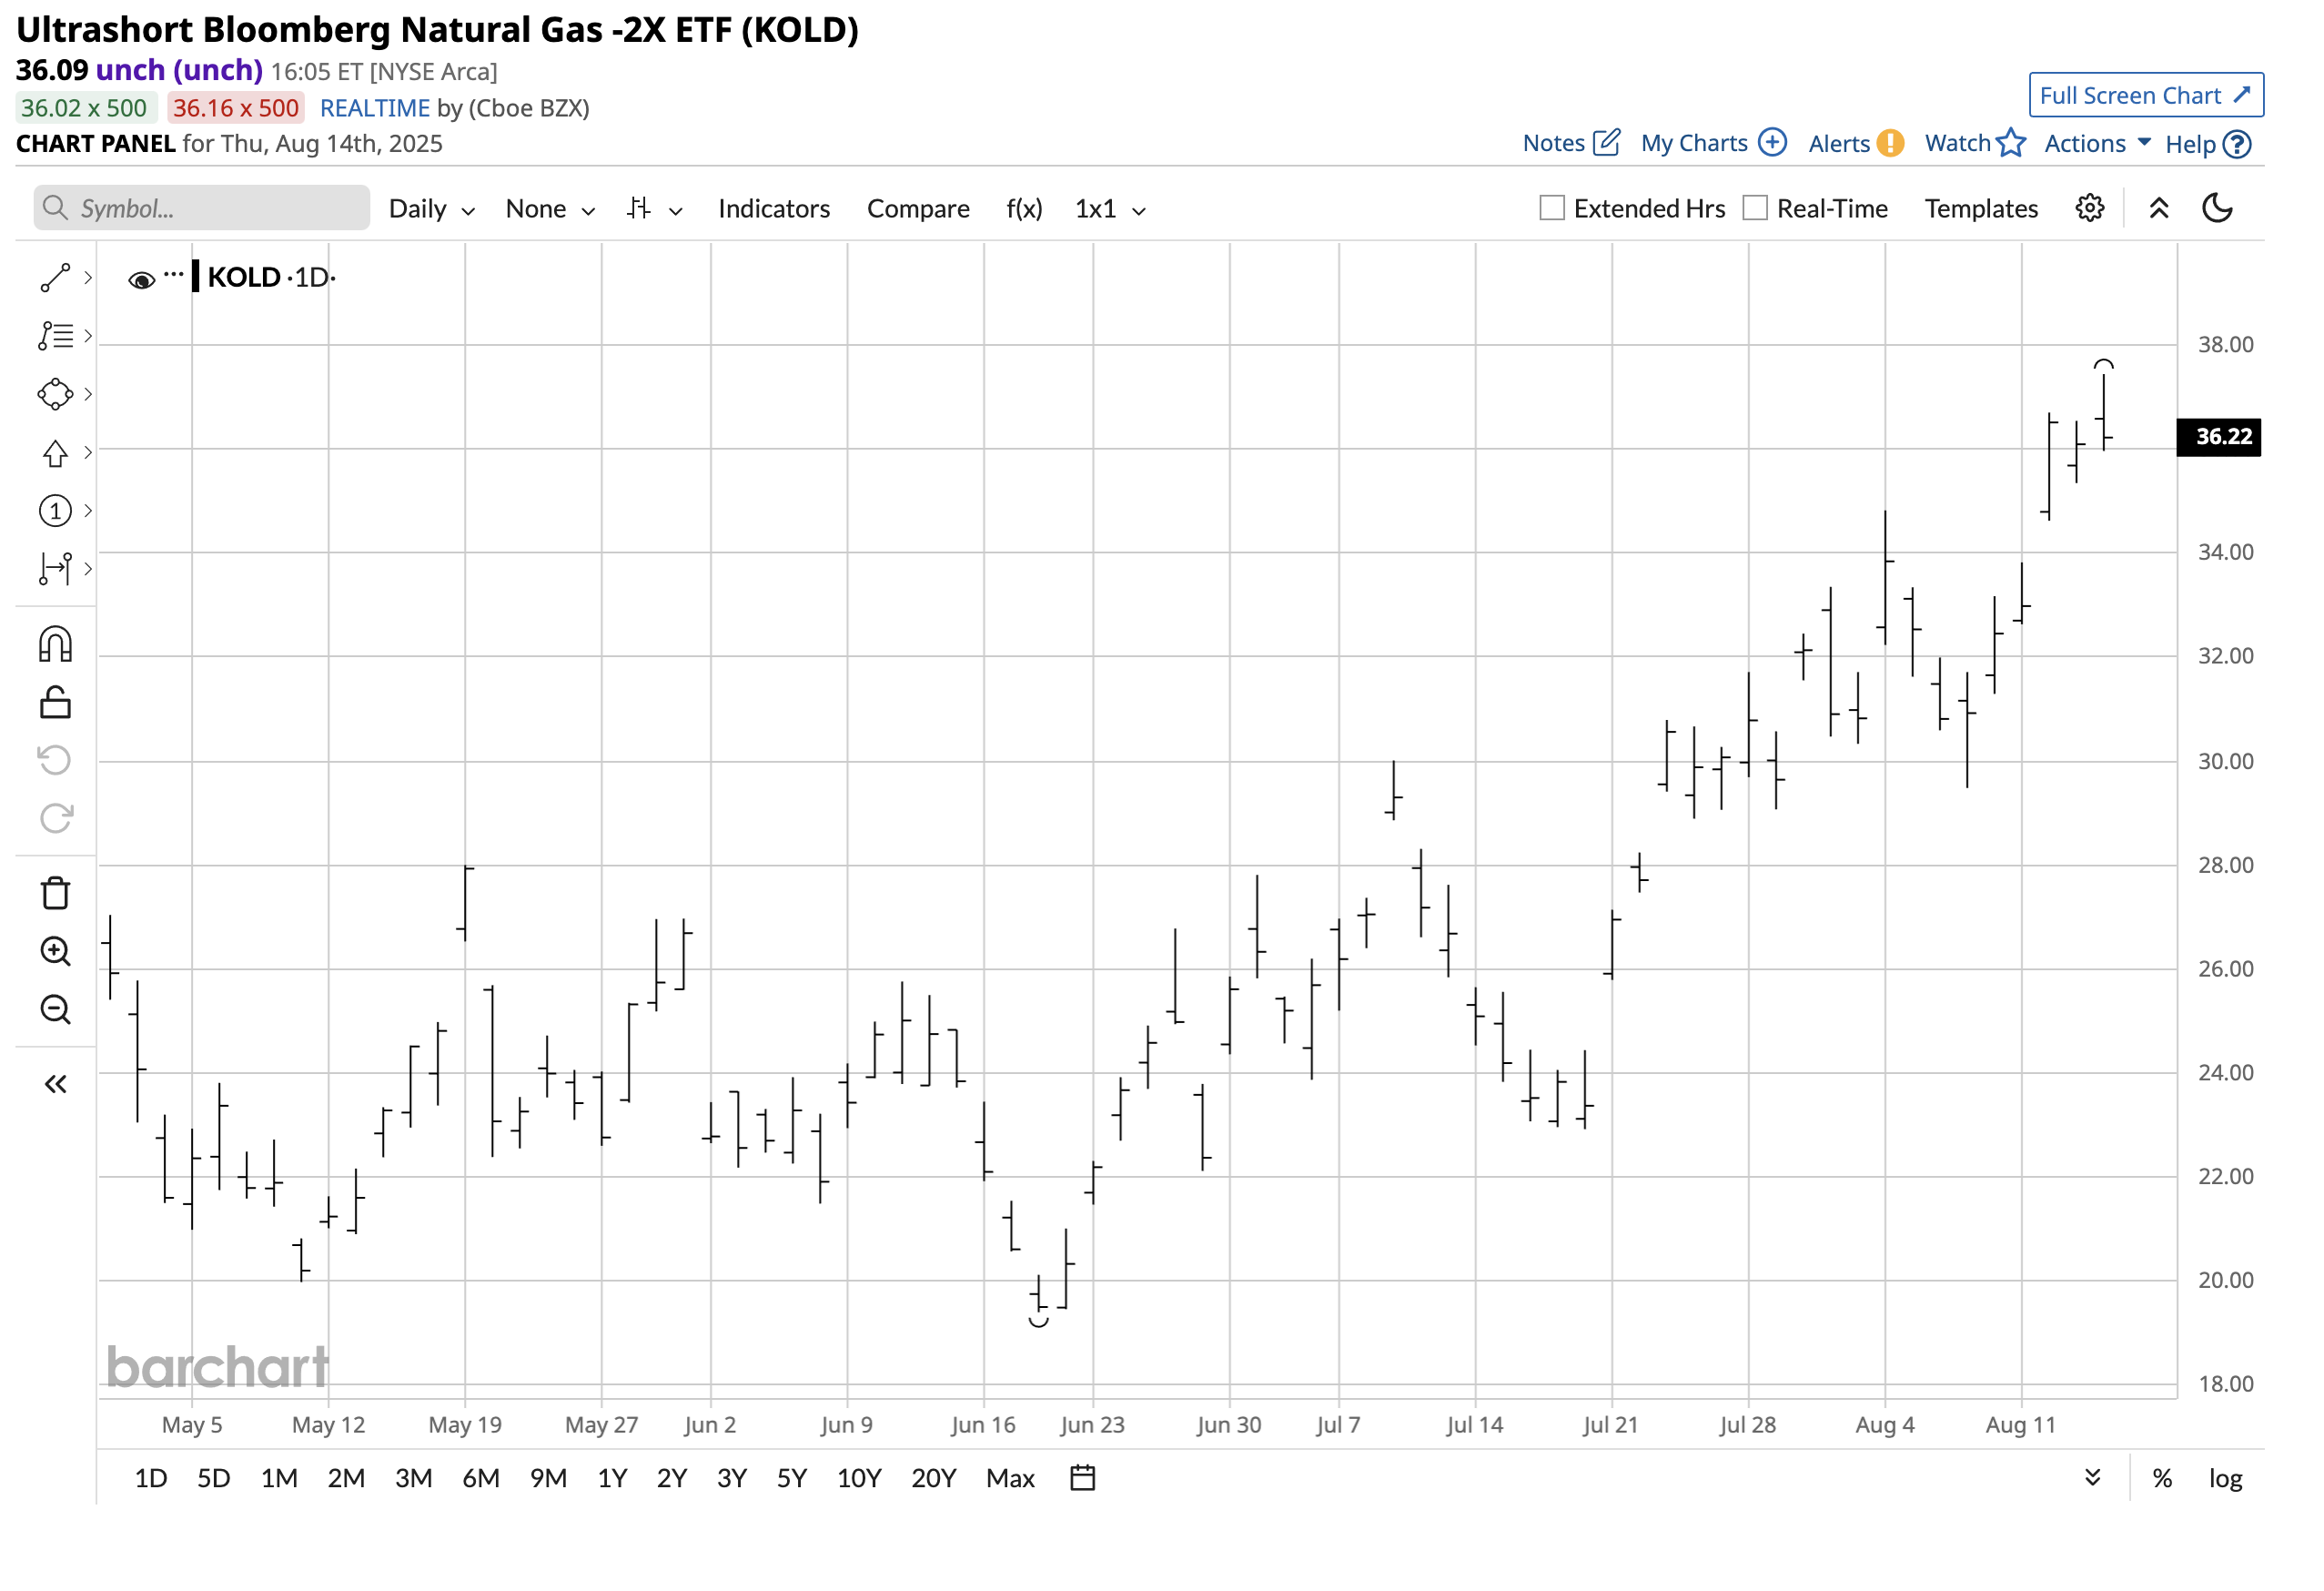
The chart shows the 63.4% rise in the BOIL ETF from $22.92 to $37.44 per share from July 18 low to the August 14 high.
One of the leading drawbacks of the UNG, BOIL, and KOLD unleveraged and leveraged ETFs is that natural gas trades around the clock, while the ETFs are only available during U.S. stock market hours. The ETFs can miss highs or lows occurring when the stock market is closed.
Leveraged ETFs have an additional risk, as the gearing involves time decay. If natural gas prices move contrary to expectations, BOIL and KOLD will experience greater percentage losses. Moreover, if prices remain stable, time decay will erode the leveraged ETFs’ prices. Meanwhile, BOIL and KOLD’s leverage increases the odds of periodic reverse stock splits, which can destroy value.
As natural gas heads into its peak season, the odds favor higher prices over the coming months. The U.S. inventory levels suggest a limited downside risk at around the $3 per MMBtu level over the coming months even though the price is lower in mid-August, which could be an opportunity. Meanwhile, BOIL and KOLD require time, and price stops as the leverage involves elevated risks, making them only appropriate as short-term trade tools and natural gas is a highly volatile commodity that can defy fundamentals when the price is moving lower or higher.
On the date of publication, Andrew Hecht did not have (either directly or indirectly) positions in any of the securities mentioned in this article. All information and data in this article is solely for informational purposes. For more information please view the Barchart Disclosure Policy here.