It's not your imagination. We're just over halfway through 2022 and rainfall records are tumbling as the east coast hunkers down for more to come.
In some parts of Australia, it has felt like the rain has barely stopped in 2022.
Day after day, week after week, the rain has fallen.
After repeated inundations, and dozens of deaths in floodwaters this year, many are desperately wanting a reprieve.
Early July saw another round of heavy rain across Sydney and parts of the state and along with it another round of evacuations, flooding, and damaged homes.
But with water systems so sodden, dams full to the brim, and a 50-50 chance of another La Niña this year — our third in three years — the next flood might not be that far off.
The heaviest falls have been along the east coast and one of several hotspots has been Sydney.
This chart shows the cumulative rainfall since the start of 2022 at the Observatory Hill weather station.
In it, you can see a timeline of extreme rain.
In fact, in the first six months of the year, there were only 74 days where the Observatory Hill station didn't record some rain. On average you'd expect more than 100 rain-free days in that time.
At this weather station, perched above the CBD, we have 165 years with complete or near-complete rainfall data, dating back to the year 1858.
The first half of 2022 has been wetter than all of them.
This chart shows that visually. Most of the time, annual rainfall lies within the shaded region, totalling between 822mm and 1,643mm at year's end.
Prior to 2022, the highest year-to-date rainfall we'd seen each day is shown by the dashed line.
The wettest year on record is 1950, when 2,194 millimetres were recorded.
If the second half of July is as wet as the first, that record would be nearly broken by August.
Rainfall patterns are similar at nearby weather stations, including the city's botanic gardens, Sydney airport, Centennial Park, and at Randwick in the city's east.
Moving west, the rain gauge at Katoomba in the Blue Mountains is also showing higher annual rainfall than the historic maximum for this time of year.
Dr Nina Ridder from the University of New South Wales' Climate Change Research Centre says we've seen an example of what's called a "compound event", where climate factors interact to create a string of linked weather extremes.
"We have several extreme rainfall events hitting the same areas over and over again," Dr Ridder says.
"That exacerbates the impact because you're just in the middle of cleaning up and then you get flooded again."
East coast rain on a high
But of course, greater Sydney is not the only place feeling soggy.
Here are the year to date rainfall figures for 184 weather stations across the country.
A bit over a hundred kilometres north of Sydney, rainfall totals have rocketed up this month.
The Hunter Valley copped a bucketing, with flood waters hitting Maitland, Wollombi and Singleton.
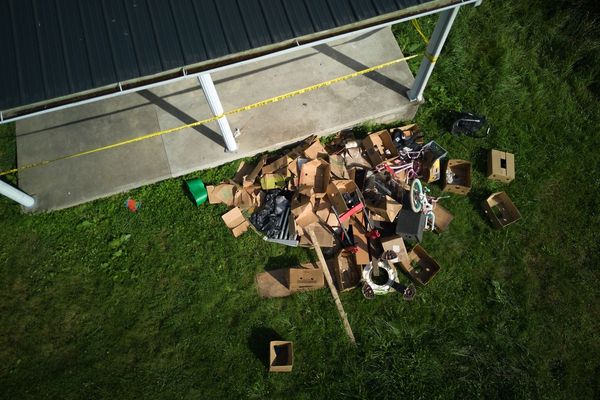
In Singleton, backyards and trampolines were consumed as waters rose.
You can see from the high water mark that more buildings would have had sludgy brown water lapping at their doorsteps.
The scale of rainfall can be seen in the town of Broke, in the same catchment.
The weather station there recorded 227 millimetres of rain over four days this month.
That's more than a third of the average annual rainfall for the town, based on 93 years worth of data going back to 1887.
Destructive and deadly
Moving further up the Pacific Highway, the state's northern rivers region has been devastated.
In a part of the country that's used to getting significant rain, 2022 is on track to be off the charts.
Take Mullumbimby.
The rain gauge there has recorded more than 2,500mm of rain since January 1.
That's more than has ever been seen before by this point in the year.
But 1972 — Mullumbimby's wettest year on record — only took that title in October, after a massive deluge hit the region, shown in blue on this chart.
As in this year's case, that downpour in 1972 also led to flooding in Lismore, with waters reaching heights of more than 10 metres.
Less than 18 months later, the town was struck by the now infamous 1974 floods, the biggest on record.
At least until 2022 came along, when waters hit 14 metres.
This year has been remarkable not just because of the quantity of rain, but the regularity of it too.
So far, Mullumbimby has recorded significantly more days with rain than you'd ordinarily expect.
Brisbane and south east Queensland
North of the Tweed, we've seen the Brisbane river burst its banks, suburban homes inundated, pontoons washed away, and scores of rescues.
More than half of the rain came in just four days, from February 25 to 28.
That tremendously wet week is the near-vertical line in this rainfall chart.
Flooding affected areas south to the border, north to the Sunshine Coast and Gympie, and west, to one of Australia's major food bowls.
Here's 2022's rainfall for Harrisville, a town in the Scenic Rim region.
The flooding in the region has affected many more Australians than those who live there.
More than 44 million kilograms of lettuce — more than a third of the nation's production of the salad staple — are grown in south east and southern Queensland in a year, according to the 2019-20 agricultural census.
It's not a coincidence that an iceberg now costs so much.
Dr Ridder says we'll need to think about how we adapt to these kinds of conditions.
"Regions become floodplans that haven't been floodplains," she says. "On the other hand, there are regions that we build on that are actually known to be floodplains, only we've forgotten because we have [had] a long time with dry conditions.
"We have to reassess where we build and how we build, and also take into account the different processes that interact and feed back into each other.
"If we have these fundamental climate conditions, it is very likely that we will see a sequence of extreme rainfall events, and if we have these rainfall events, this increases the probability of flooding."
Up to triple the norm
Let's return to our map of 184 weather stations. We've chosen to look at these because for all of them, we have at least 100 years’ worth of historic data.
This time, we'll take a look at how much rainier each location has been in 2022, compared to the location's median rainfall.
In Sydney, there's been more than 2.5 times the rainfall you'd typically expect by this point in the year.
Just south of the city, on the outskirts of the Royal National Park, Darkes Forest has had more than triple its typical rainfall.
In fact, there's been at least double the median rainfall in dozens of locations, including Mullumbimby in NSW, and Esk, Brisbane, Mt Tambourine, Gympie in Queensland.
The heaviest rains have stayed north of the Murray, almost as though La Niña respects state borders.
In South Australia there have been heavy rains on the Eyre Peninsula, mainly in January.
The most populated parts of Western Australia, in the south-west of the state, have been spared.
In fact, some areas like Albany are experiencing drier than average years.
Dr Ridder says this geographic pattern of rainfall is typical for La Niña conditions.
"Because La Niña is happening in the Pacific it has the biggest impact on the Australian east coast," she says.
"The strong trade winds due to the La Niña push more moisture towards the Australian coast, and we have warmer than normal surface waters.
"[The winds] don't really reach as far as Victoria and Southern Australia, and because it's a Pacific phenomenon, Western Australia is hardly impacted."
What comes next?
There's a decent chance the second half of the year will continue to be a wet blanket.
In its latest outlook published last week, the weather bureau said there's likely to be more rainfall than average from August to October virtually everywhere but the very west of the country.
Much of Queensland, NSW and the NT have a more than 80 per cent chance of seeing above-average rain.
There are several reasons for all this rain.
Firstly, meteorologists are expecting the development of a negative Indian Ocean Dipole, which increases the chances of significant rain. Ocean temperatures near the surface are also warmer than usual.
And then there's La Niña.
We're no longer in La Niña, after the weather pattern ended for the second time in as many years.
But we're back on a La Niña watch, because there's a good chance it'll form again in spring. Around half of the weather bureau's long term forecast models think that's a likely outcome.
Dr Ridder says if the weather pattern does reform for a third time, it will only be the fourth time it has happened since 1900.
"If we actually have a third one, yes, we will most likely see more flooding, because the conditions are still the same," she says.
"All the catchments, all the water storages are full.
"So as soon as there is some rain, it doesn't even have to be extreme rainfall anymore, just a little bit of rain. Just a little bit [more] than what the catchments can handle and we will see flooding again."
Take Wivenhoe Dam, for example, south-east Queensland's largest water storage. That spike of rain in February pushed the dam well above its capacity, and it's staying high.
Of course, there's another factor contributing to these more dramatic weather events: climate change.
Dr Ridder says that while Australia has always had floods and other extreme weather, climate change is making them longer, more intense and more destructive.
According to the weather bureau, Australia's climate has warmed by around 1.47 degrees since 1910.
The bureau says we're also seeing more rain come from intense, short, rainfall events than we have before.
"We know that air can hold 7 per cent more water for every degree that it warms," Dr Ridder says.
"So for every degree of warming, we have 7 per cent more water that can fall as rain."
Credits
Words: Casey Briggs
Production and editing: Leigh Tonkin
Photographs: NearMap, ABC News, AAP