What Was the Great Inflation?
The Great Inflation was a period of high inflation in the U.S. from 1965 to 1982. Some economists, though, limit the timeframe to the 1970s, when inflation peaked and subsided before peaking again. The government passed a series of measures and legislation to control high levels of inflation and unemployment, both of which contributed to stagflation.
The Great Inflation consequently changed the Federal Reserve's approach to inflation and employment—the organization began to prioritize a dual mandate to maintain a 2% inflation rate and to reach full employment via monetary policy.
What Factors Contributed to the Great Inflation?
In the 1960s, the Fed pursued a policy of seeking full employment via a low unemployment rate while allowing for high inflation, creating a negative correlation between the two in what’s defined as the Phillips curve. That was in line with the economic policy set out with the Employment Act of 1946, which was aimed at promoting high levels of employment, production, and purchasing power.
Prior to the late 1960s, the unemployment rate was significantly higher than the inflation rate, and Fed policymakers surmised that the risk to inflation would be high but would reduce unemployment.
As the 1970s rolled by, the Nixon administration departed from the Bretton Woods system by abandoning the gold standard—which fixed the dollar to a specified amount of gold—because of strong global demand for the dollar. This allowed the dollar to float freely and become a fiat currency, which meant that it was backed by the good faith of the U.S. government.
From 1965 to 1970
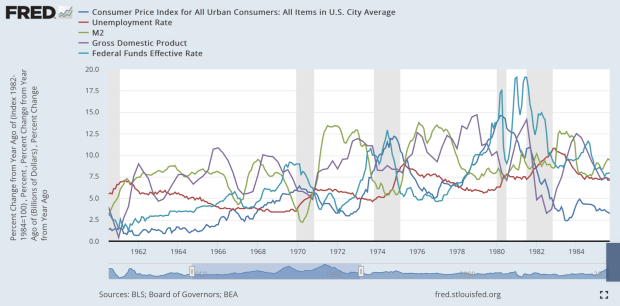
The inflation rate, as measured by the consumer price index, in the years prior to 1965 was relatively low, at around 1 percent. But by the end of 1965, inflation accelerated to around 2 percent, and by 1970, to 6 percent.
The Fed had embarked on increasing money supply, partially by raising banks’ reserve balances. A higher reserve balance puts more money into banks that deposit with the Fed, and that effectively puts more money into circulation. By allowing more money to work its way into the economy, the Fed expected that more people would be employed and thereby achieve a low unemployment rate—with the tradeoff of inflation accelerating.
At the same time, the Fed tightened monetary policy to keep up with inflation by effectively raising the federal funds rate. The central bank recognized that interest rates couldn’t stay at the same rate while inflation was high, so it strived to maintain positive real interest rates.
The unemployment rate remained low at around 3.5 percent from 1965 until 1970, when it reached 6 percent. Inflation started to creep up during the late 1960s, and that slowed growth—pushing the economy into recession in 1970. Together, these factors pushed the economy into a period of stagflation.
Early to Mid 1970s
To keep inflation in check, the Economic Stabilization Act of 1970 was passed during the Nixon administration to stabilize prices, rents, wages, and salaries. Inflation and unemployment rates declined from 1971 to 1972, but they started to pick up in 1973 when the Organization of the Petroleum Exporting Countries (OPEC) imposed a crude oil embargo on the U.S. for providing emergency aid to Israel for the Yom Kippur War.
An energy crisis ensued, and inflation accelerated—peaking at more than 12 percent in 1974—and pushing the nation once again into a period of stagflation. The Fed tightened monetary policy while at the same time increasing the money supply. The inflation rate dropped to 5 percent in 1976, and the economy emerged from recession.
It was during this period that the Fed started to differentiate inflation caused by aggregate demand into two categories: demand-pull inflation, which was the result of monetary policy; and cost-push inflation, wherein costs are passed on to consumers.
Also, the dollar’s value started to depreciate because of the loss of its peg to gold. OPEC members, which feared that the value of their dollar holdings would decline, started to quote oil prices in gold, and prices of the precious metal soared into the late 1970s.
Late 1970s to Early 80s
Another energy crisis occurred after the 1978 revolution in Iran—a major producer and exporter—led to an embargo, and a surge in oil demand sent oil prices soaring. Inflation accelerated quickly, from around 6 percent in 1978 to almost 15 percent in 1980. Meanwhile, the unemployment rate dropped to 5.6 percent in 1979 from 9 percent in 1975 before picking up again and pushing the economy once again into stagflation.
How Did the Great Inflation End?
Paul Volcker, who took the helm of the Fed as chairman in 1979, was willing to risk high unemployment as a tradeoff to lower inflation by aggressively tightening monetary policy. At the same time, he recognized that money supply had been increasing on the premise that more money in the economy would lead to more jobs.
Volcker led a series of tight and aggressive monetary policy initiatives—at one point sending the Fed funds rate to 19 percent in 1981—and curbed growth in the money supply. The economy slipped into a recession in 1980, and a deeper one in 1981–82, but inflation eventually dropped to around the 2 percent level in 1983.
Aftermath of the Great Inflation and Lessons Learned
In the aftermath of the Great Inflation, the Fed reconsidered its monetary policy and emphasized keeping inflation low—specifically setting a target of 2 percent inflation as part of its dual mandate. Sudden supply shocks such as the two energy crises in the 1970s were major disruptions to the economic and financial systems in the U.S.
In a twist of the Phillips curve, the opposite of what some economists wanted to achieve occurred at the end of 1982, when the inflation rate dropped to around 4 percent but the unemployment rate soared to 11 percent. Some economists, though, would argue that monetary policy was implemented in response to inflation, rather than policy having affected inflation.
With the abandonment of the gold standard, the government could print money and put that money into circulation to drive economic growth. This brought on a new monetary system.
Oil became an expensive commodity, and that pushed governments to encourage the development of alternative sources of energy such as solar and nuclear. The International Energy Agency was established in 1974 to coordinate against major disruptions to the oil supply.
With inflation decelerating, the Fed eased monetary policy, and the drop in interest rates from their highs in the early 1980s led to one of the greatest bull runs in the stock market—lasting from 1982 until the dot-com bubble burst in 2001.
Still, as the U.S suffered through high inflation and recessions, other countries such as the U.K. experienced the same, demonstrating the global economy’s strong links to the U.S. through trade.