Dogecoin (CRYPTO: DOGE) was trading slightly higher on Saturday in continued consolidation after volatile sessions earlier in the week, where the crypto spiked up over 21% on Tuesday before falling 17% on Wednesday. Another smaller surge on Friday saw Dogecoin rise over 7% off the 24-hour opening price.
The consolidation on Saturday was taking place within Friday’s trading range, which has settled Dogecoin into an inside bar pattern on the daily chart. An inside bar pattern is usually followed by a continuation move in the direction of the current trend, but in Dogecoin’s case the recent volatility has clouded the crypto’s implied direction.
An inside bar pattern has more validity on larger time frames (four-hour chart or larger). The pattern has a minimum of two candlesticks and consists of a mother bar (the first candlestick in the pattern) followed by one or more subsequent candles. The subsequent candle(s) must be completely inside the range of the mother bar, and each is called an "inside bar."
A double, or triple inside bar can be more powerful than a single inside bar. After the break of an inside bar pattern, traders want to watch for high volume for confirmation the pattern was recognized.
- Bullish traders will want to search for inside bar patterns on stocks that are in an uptrend. Some traders may take a position during the inside bar prior to the break, while other aggressive traders will take a position after the break of the pattern.
- For bearish traders, finding an inside bar pattern on a stock that's in a downtrend will be key. Like bullish traders, bears have two options of where to take a position to play the break of the pattern. For bearish traders, the pattern is invalidated if the stock rises above the highest range of the mother candle.
Want direct analysis? Find me in the BZ Pro lounge! Click here for a free trial.
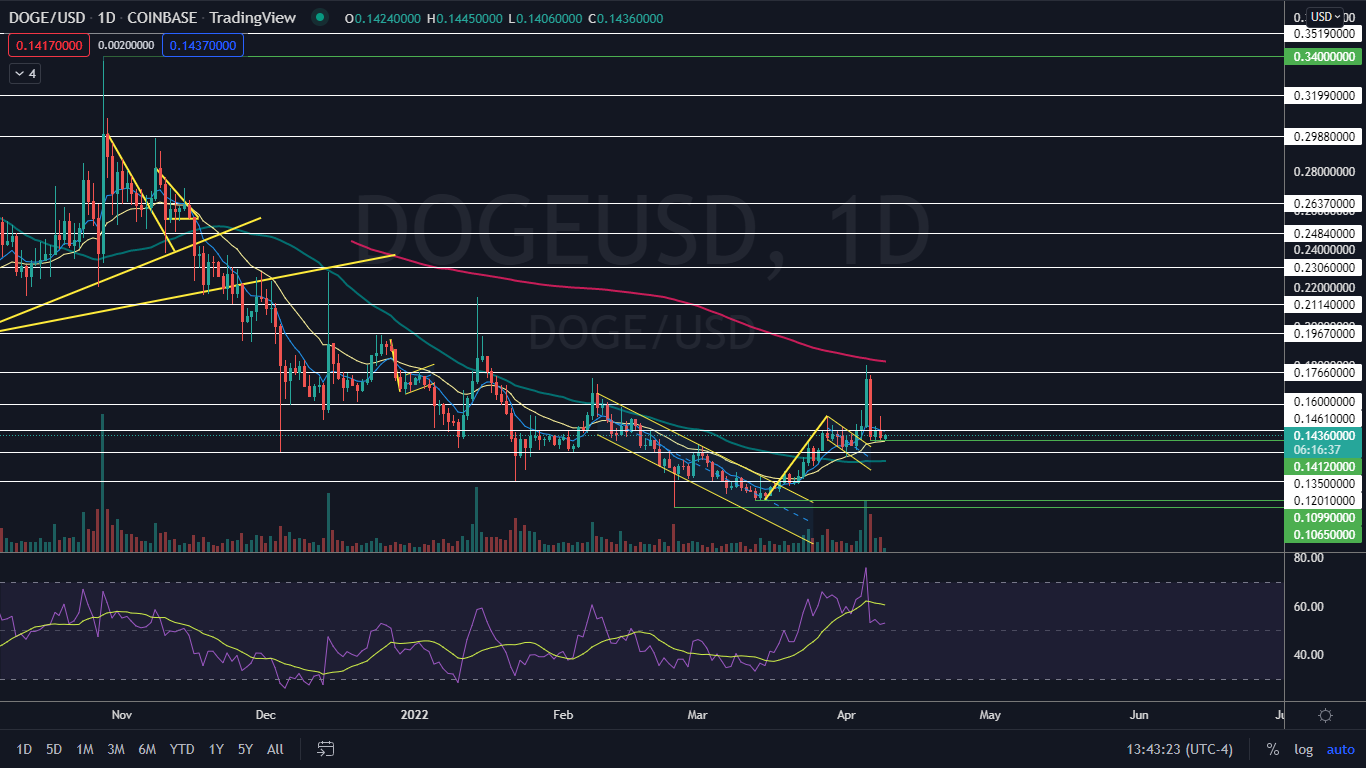
The Dogecoin Chart: Dogecoin’s inside bar pattern is neutral because although the month-long trend is bullish, the most recent action indicates a number of failed break-outs, which has resulted in bull traps. Traders and investors can watch for a break up or down from Friday’s mother bar later on Saturday or on Sunday to gauge future direction.
- Over the past 24-hour trading sessions, Dogecoin has printed a quadruple bottom pattern just above the 14-cent level, which is bullish. The price action at that level indicates bulls are coming in to defend the area as support by buying the crypto. If bullish volume comes in over the next couple of days to indicate the quadruple bottom has been recognized, Dogecoin is likely to shoot up higher.
- On Saturday, Dogecoin was trading sideways on lower-than-average volume, which further indicates consolidation. By early afternoon, Dogecoin’s volume was measuring in at just about 66 million on Coinbase, compared to the 10-day average of about 446 million.
- Dogecoin is trading below the eight-day exponential moving average (EMA) but above the 21-day, which is helping to support the crypto. Dogecoin bulls will want to see the crypto regain the eight-day EMA as support, which will happen if there’s a bullish reaction to either the quadruple bottom pattern or the inside bar formation.
- The crypto has resistance above at $0.146 and at 16 cents, and support below at 14 cents and the $0.135 mark.
See Also: Dogecoin, Tesla In Top 10 But This Crypto Is Robinhood's Top Recurring 'Buy' Asset