The US dollar index moved into a long-term uptrend at the end of July indicating the US Federal Open Market Committee could raise interest rates over the coming months.
-
Fundamentally, the corn market looks to have the most fundamental reason to rally over the next year.
Join 200K+ Subscribers: Find out why the midday Barchart Brief newsletter is a must-read for thousands daily. Soybeans and wheat could continue to drift until reads on real fundamentals grow more bullish.
As I talked about last time, the US dollar index moved into an uptrend on its long-term monthly chart at the end of July. The implications of this, from a fundamental point of view, is that the US Federal Open Market Committee could raise the Fed fund rate over the coming months rather than making the cuts demand by the US president. Why? Based on my Market Rule #5, I don’t like to spend as much time as most others in the industry making up reasons for something, but in this case the picture is clear: Interest rates would go up to strengthen the dollar to fight the inflation that is all but inevitable when trade wars and tariffs are used as the primary form of “policy” (I use that term loosely to describe the current situation). Where did all this leave a handful of key investment markets at the end of July, from a technical point of view? Let’s take a look.
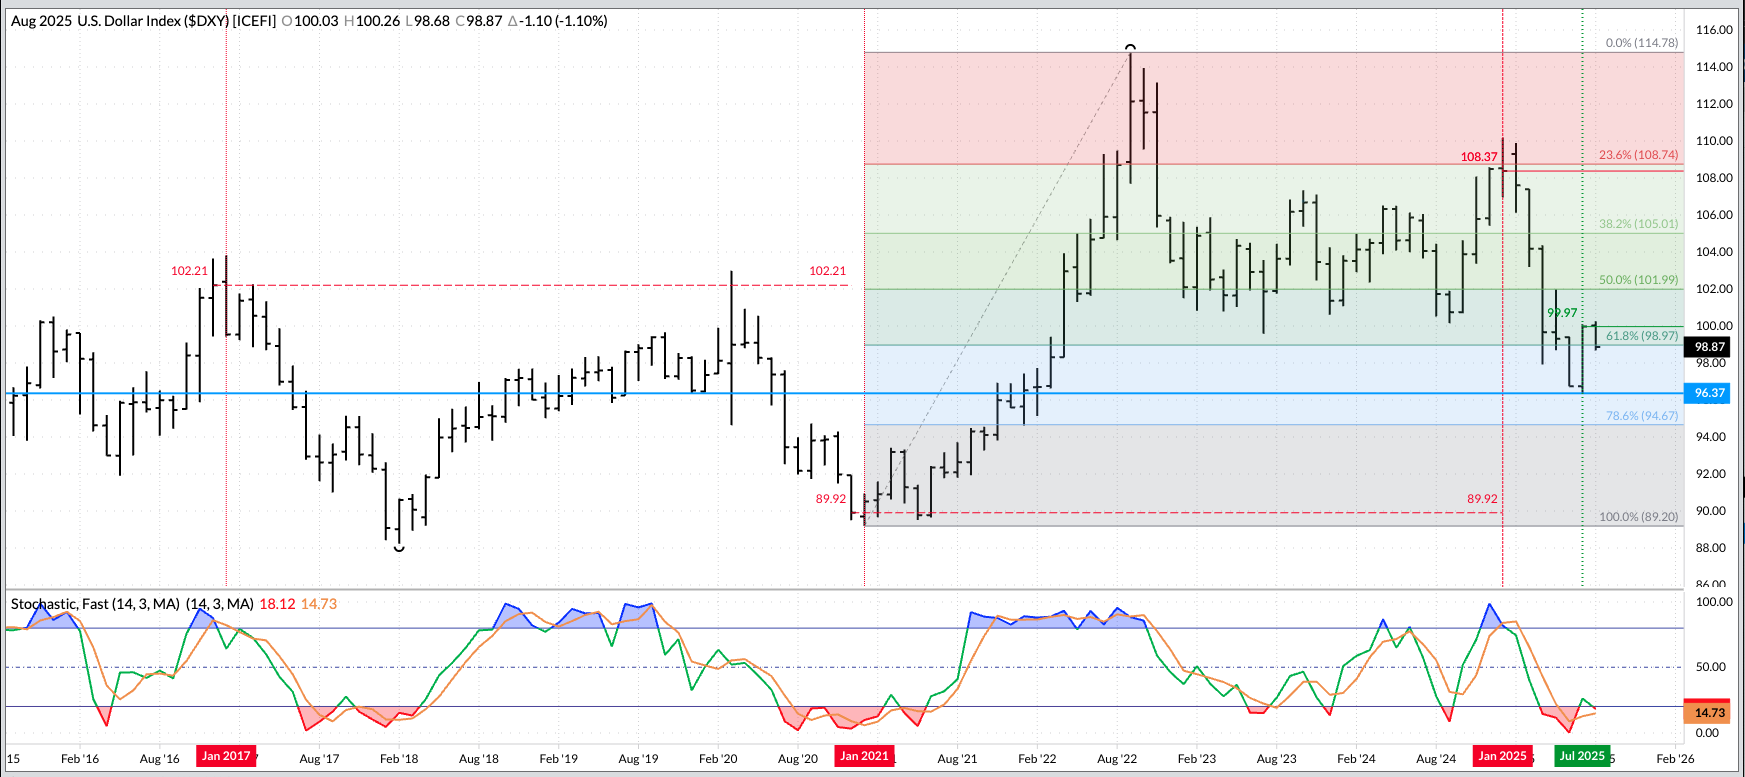
The US dollar index ($DXY) did complete a bullish key reversal[i] during July, confirming a move to a long-term uptrend. Given the main fundamental factor of the dollar is interest rates, the implication is the US Federal Open Market Committee could raise rates over the coming months rather than make cuts. We’ll see. It should be noted monthly stochastics moved back ABOVE the oversold level of 20% before establishing a bullish crossover. This leaves the door open to a possible pullback by the Index before gaining bullish momentum. This means the Index, while in a long-term uptrend, could sell off over the coming months but hold above the July low of 96.37.
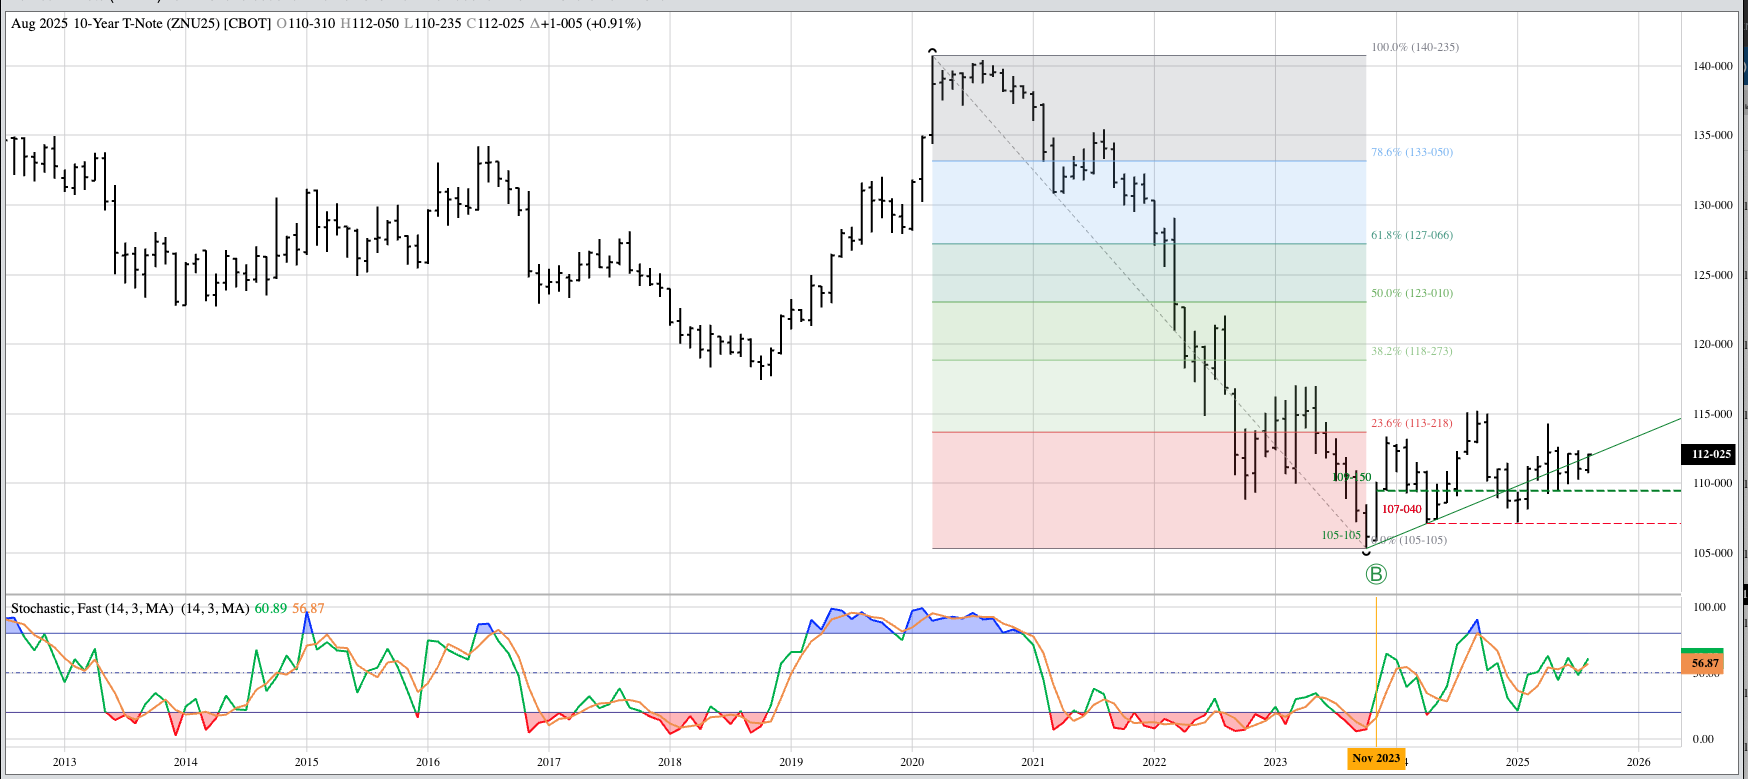
With the US 10-year T-note (ZNU25), I’m going to continue to call the long-term trend sideways. If the US Fed is forced to raise interest rates to fight inflation tied to trade wars and tariffs, longer-term US Treasury instruments could come under increased pressure. As of the end of July, the 10-year futures market continues to consolidate within the April 2025 range. As for long-term positions, it’s possible longs were established near the November 2023 close of 109-150 based on a bullish 2-month reversal pattern[ii].
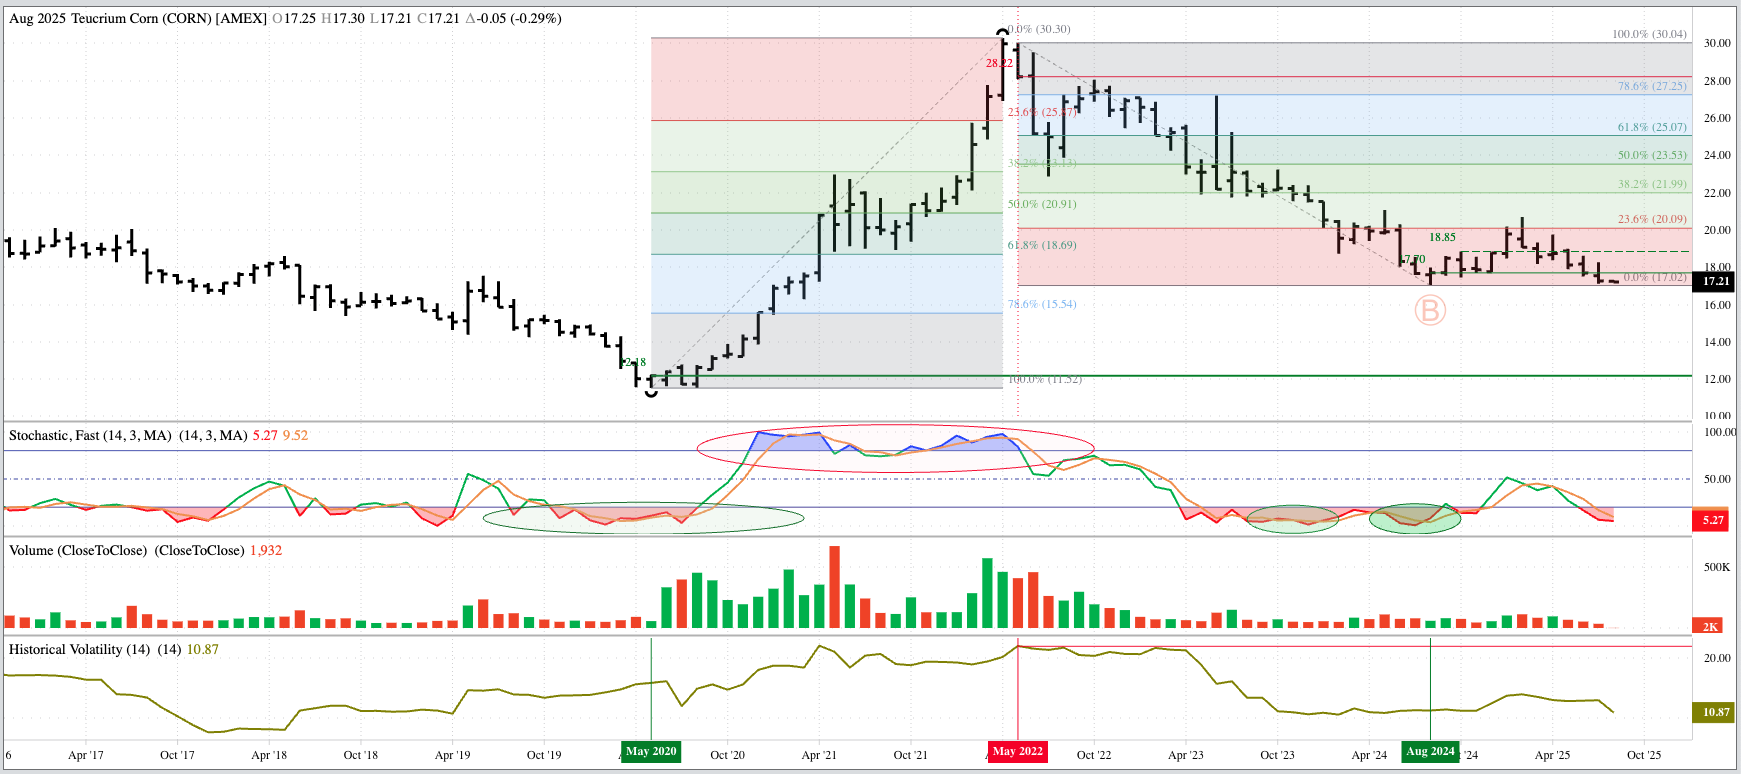
The Teucrium Corn Fund (CORN) is also in a long-term sideways trend. CORN closed July at $17.26, down $0.43 for the month after posting a low of $17.11. This held the August 2024 mark of $17.02. Long-term investors might’ve bought CORN near the August 2024 settlement of $17.70. Is there a fundamental reason to be long CORN? As July came to an end, the deferred the May26-Jul26 futures spread covered a bullish 30% calculated full commercial carry[iii] indicating the commercial side is not as optimistic about supplies in relation to demand next spring. For comparison, the end of June saw this same spread covering 32% while the 2025 edition of the spread covered 36% at the end of July 2024.
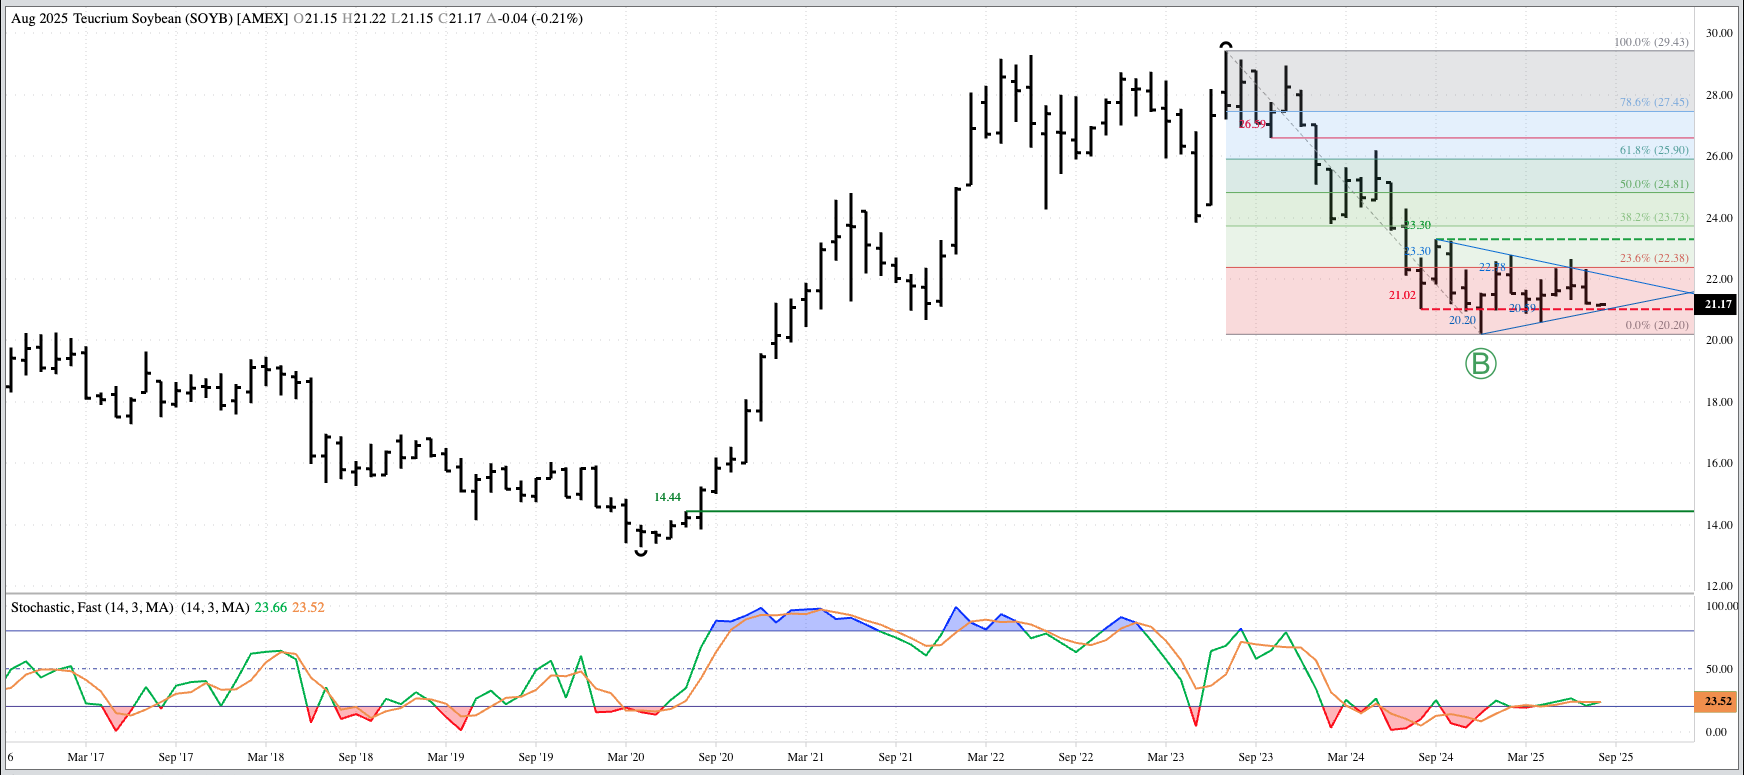
The Teucrium Soybean Fund (SOYB) is in a major sideways trend, highlighted by converging trendlines. July saw SOYB close at $21.21, down $0.57 for the month. support remains at the previous 4-month low of $20.59 (April 2025) with resistance at the previous 4-month high of $22.65 (June 2025). It’s possible Investors bought near the December settlement of $21.48 based on the completion of a bullish spike reversal pattern[iv] as 2024 came to an end. From a fundamental point of view, this same group of investors are likely not as enthusiastic as they are in corn. The Nov25-Jul26 forward curve closed July at a carry of 60.5 cents and covered a neutral 56% calculated full commercial carry as compared to the end of June 44% and the Nov24-Jul25 spread’s 56.5 cents carry and 49% at the end of July 2024. The bottom line is supply and demand is less bullish than it was a year ago at this time.
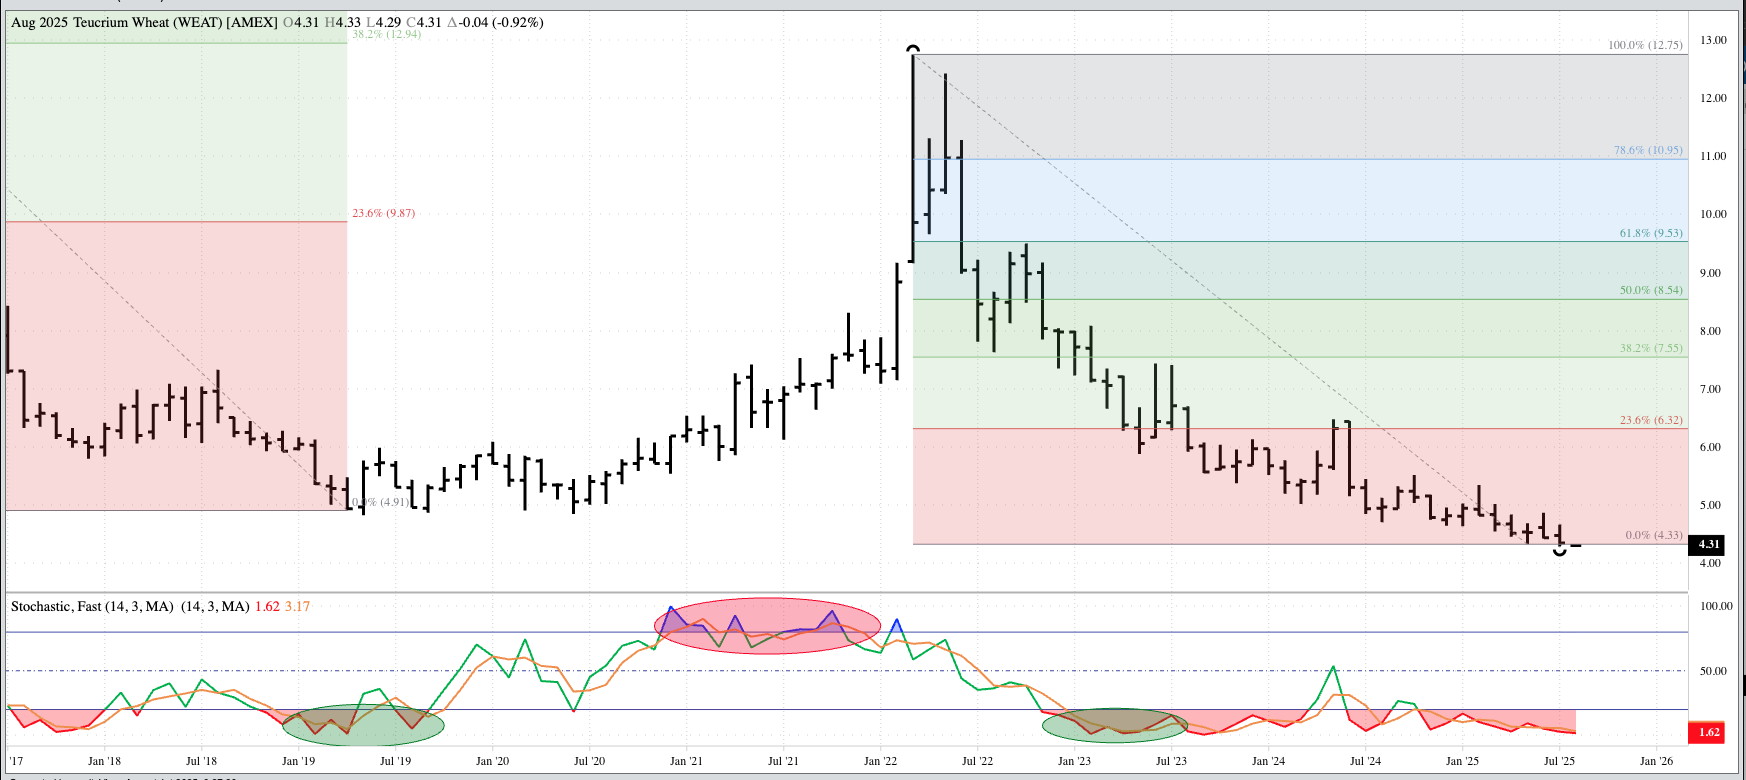
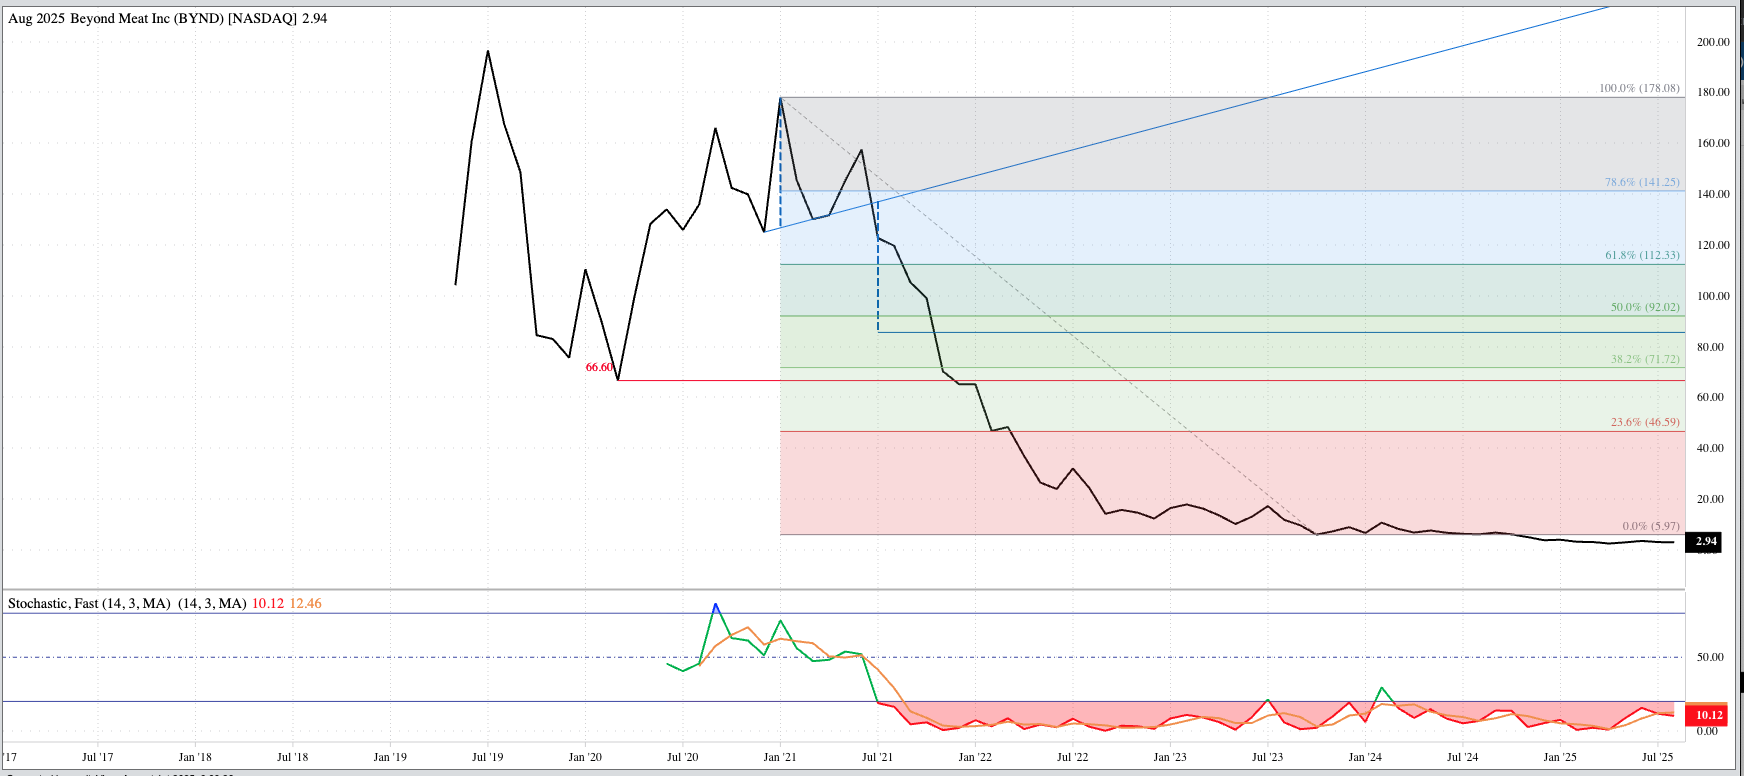
The Teucrium Wheat Fund (WEAT) remains in a major downtrend as it posted a new low of $4.29 in late July before closing at $4.35, down $0.09 for the month. This was also a new all-time low monthly close. Fundamentally the Sept25-May26 forward curve closed July at a carry of 49.25 cents and covered 56% calculated full commercial carry. The June close showed a carry of 51.5 cents and 58% with the Sept24-May25 spread finishing July 2024 at a carry of 58.0 cents and 64%. Investors are likely on the sidelines, though some may have gone long on the idea of “How Much Lower Can It Go”? To them I will show the monthly close-only chart for Beyond Meat (BYND).
[i] The Index traded outside the June range before closing higher for the month. This is one of the more reliable technical reversal patterns I look for on any time frame (short-term daily, intermediate-term weekly, long-term monthly).
[ii] Month 1 sees the market close near its monthly low before closing near its monthly high at the end of Month 2.
[iii] Total cost of storage and interest to hold cash bushels in commercial storage.
[iv] The market moved to a new low for the previous downtrend before closing higher for the month.
On the date of publication, Darin Newsom did not have (either directly or indirectly) positions in any of the securities mentioned in this article. All information and data in this article is solely for informational purposes. For more information please view the Barchart Disclosure Policy here.