
While we've seen the first hot winds of government numbers so far this week, the big storm surge of silliness is expected Friday through next Wednesday.
-
In the Corn market, from a fundamental point of view - and I mean real supply and demand - we already know the commercial side has built in the most bearish case scenario.
Don’t Miss a Day: From crude oil to coffee, sign up free for Barchart’s best-in-class commodity analysis. In the Soybean market, merchandisers are showing us they expect a good deal of the 2025 crop to be sold at harvest.
Morning Summary: There are times when sitting in my basement office, staring at a flashing quote screen, I understand what Isaac Cline must’ve thought as he looked out at the GULF OF MEXICO roughly 125 years ago. Cline was the chief meteorologist at the Galveston, Texas office of the U.S. Weather Bureau, and according to the book “Isaac’s Storm”[i], he could sense what was coming. The 1900 Galveston hurricane would become “the deadliest natural disaster in the history of the United States”. No, what happens over the coming days isn’t life and death, but markets in a number of sectors could certainly be swept out to the figurative sea. I’m talking about the storm of government numbers and announcements headed our way. We’ve already seen the August Producer Price Index and Consumer Price Index giving us mixed reads on inflation Wednesday and Thursday[ii]. Today, Friday, the ag sector will get its monthly dose of imaginary USDA supply and demand estimates, almost guaranteed to trigger Watson one way or the other. But these are all just initial winds, with the main storm surge coming at us in the form of next week’s US Federal Open Market Committee meeting and expected announcement of a 25-basis point rate cut.
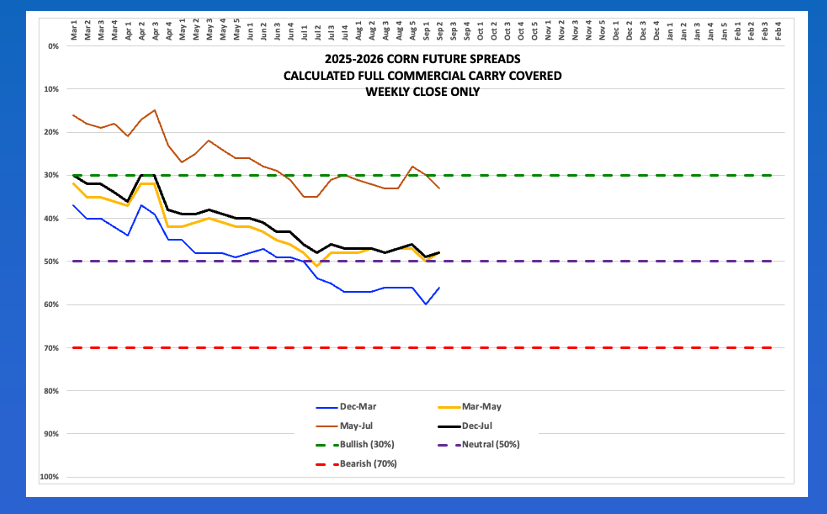
Corn: The corn market was quiet early Friday morning. Did you notice I took out the direction this time around? The December issue (ZCZ25) was sitting at unchanged after posting an overnight trading range of 1.75 cents, from down 1.0 cent to up 0.75 cent on trade volume of only 12,000 contracts. Is Watson waiting for Uncle Sam’s Department of Agriculture silliness? Most likely. What else does it have to do at this point? We know the US is going to harvest a large corn crop in 2025, and we also know the commercial side seems to have already priced in the most bearish case scenario given futures spreads have stabilized. Thursday’s close showed the Dec-March spread covered 56% calculated full commercial carry as compared to last Friday’s settlement covering 60% with the Friday before that at 56%. Similarly, the Dec-July forward curve covered 48% Thursday afternoon, generally holding steady since the weekly close the second week of July. Additionally, the National Corn Index came in at $3.78 last night, up about 2.25 cents for the day after Dec25 closed yesterday with a gain of 2.75 cents. This put national average basis at 41.75 cents under December futures as compared to last Friday’s final figure of 41.5 cents under December.
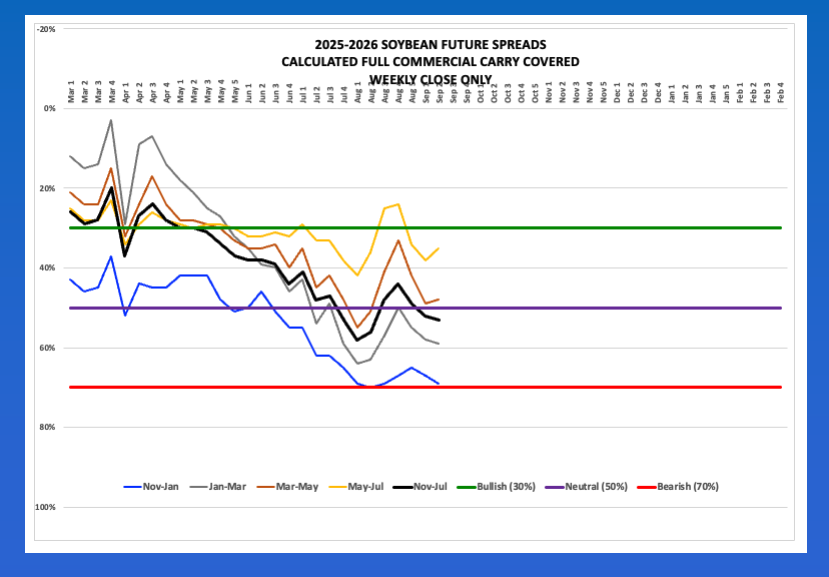
Soybeans: The soybean market was quietly lower to start the day. The November issue (ZSX25) posted a trading range of 4.5 cents, 2.25 cents either side of unchanged, on trade volume of 10,500 contracts and was sitting 1.25 cents lower at this writing. While most of the BRACE[iii] Industry is slipping into their adult diapers early Friday morning, not knowing how they will control themselves until USDA gives them the imaginary numbers they so desperately crave, the rest of us already know what the US soybean supply and demand situation is. The November-January futures spread covered 69% calculated full commercial carry at Thursday’s close, still near the bearish 70% level it has been trolling along since the first week of August. Given this, we know the US will see increased supplies due to sales of newly harvested bushels over the next couple months. This same week a year ago saw the 2024-2025 edition of this spread post a weekly close covering 64% meaning the commercial side is more bearish this time around the calendar. Meanwhile, the National Soybean Index was calculated at $9.5450 Thursday evening putting national average basis at 79.0 cents under November futures as compared to last Friday’s final figure of 77.25 cents under December.
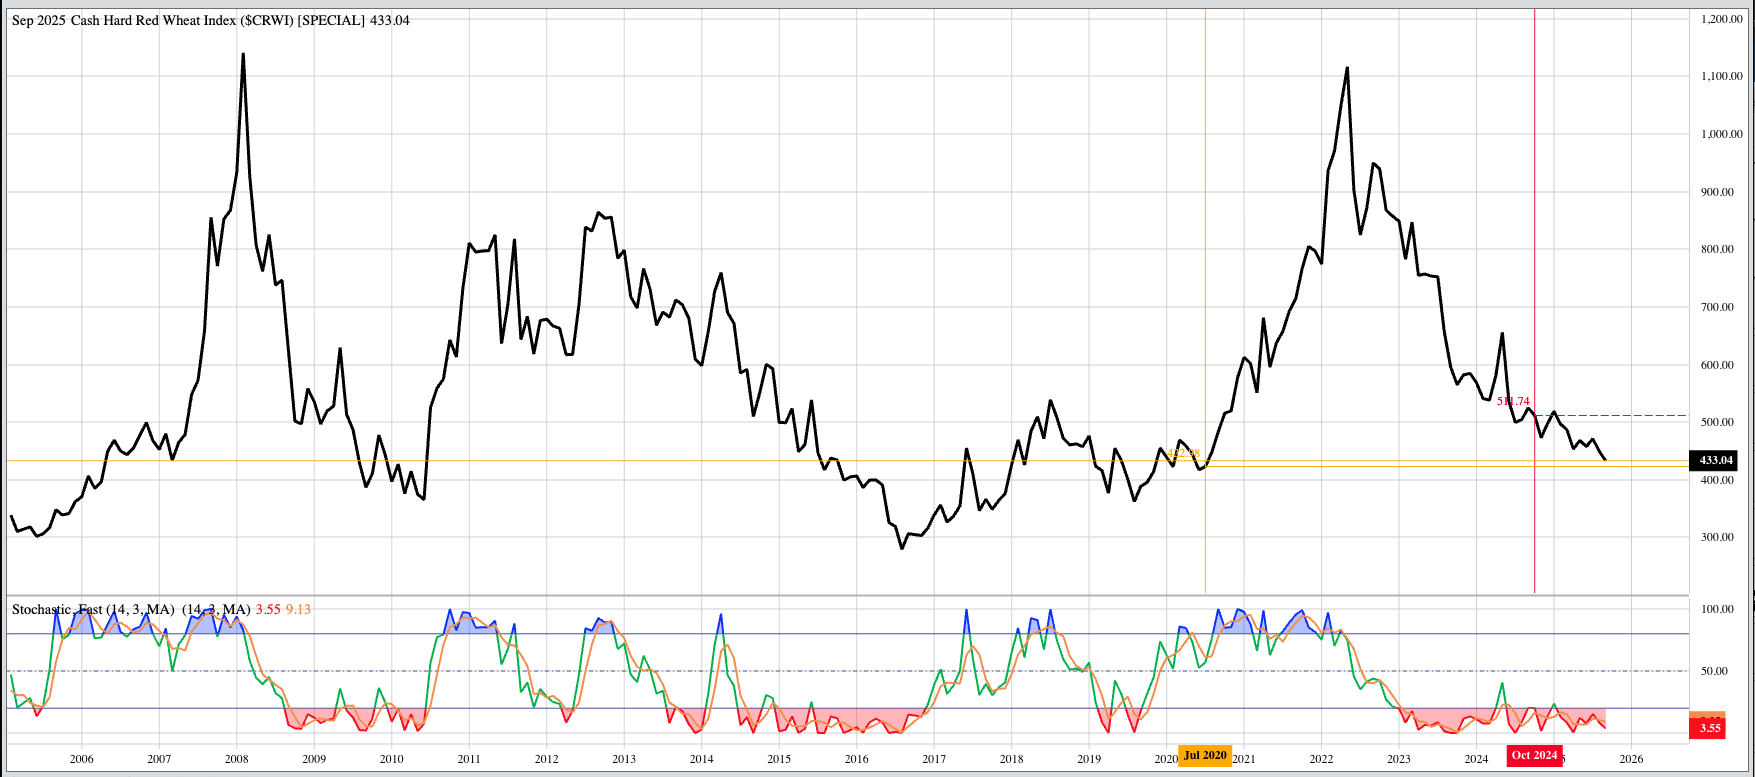
Wheat: The wheat sub-sector was quietly lower, mostly, pre-dawn Friday. If I were so inclined, I would ask those same BRACE Industry members what manna they are expecting from USDA regarding US wheat. But one, I know the majority of them are not interested in wheat and two, I’m not interested in their opinion. So there’s that. Anyway. A look at the quote screen again raises the question of if the three wheat markets were even open overnight. SRW contracts were sitting at unchanged from December (ZWZ25) through May with a quick calculation of total overnight trade volume coming in at about 5,000 contracts (Dec through May). As for real market fundamentals, the Dec-March futures spread covered a neutral 51% calculated full commercial carry at Thursday’s close while the National SRW Index came in at $4.4850. The latter put national average basis at 73.0 cents under December futures as compared to last Friday’s final figure of 72.25 cents under December. Over in HRW we see the first three issues (December through May) all sitting 0.75 cent lower on total trade volume of fewer than 2,500 contracts. The National HRW Index ($CRWI) came in last night at $4.33, what would be its lowest monthly close since July 2020’s $4.23.
[i] I highly recommend Erik Larson’s book. Among its other attributes, in the prologue the author discusses some of the Chaos events that might have occurred, setting the stage for the formation of this deadly storm.
[ii] As if we need government numbers to tell us about the inflation we can clearly see with our own eyes.
[iii] BRACE = Brokers/Reporters/Analysts/Commentators/Economists who never met a government report they didn’t believe or want to tell us all how important it is.
On the date of publication, Darin Newsom did not have (either directly or indirectly) positions in any of the securities mentioned in this article. All information and data in this article is solely for informational purposes. For more information please view the Barchart Disclosure Policy here.