Wall Street is charging ahead with unshakable confidence. The S&P 500 has soared 35% to new record highs since April's lows and Nvidia Corp. (NASDAQ:NVDA) has doubled in value.
But here's what's truly telling: traders are not hedging for a pullback—instead, they're selling volatility, doubling down on the view that this market will keep trending calmly higher.
VIX Shorts Hit Multi-Year Extremes
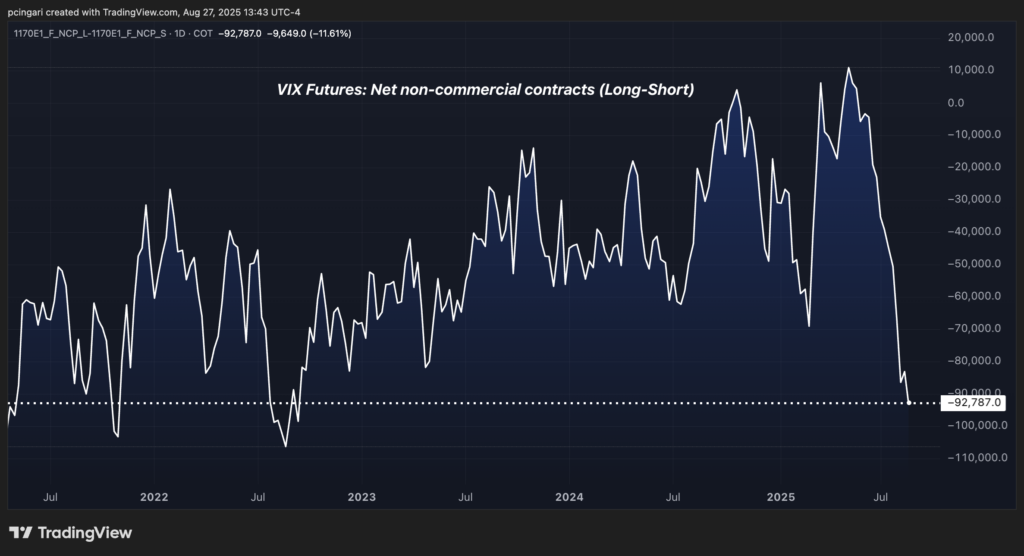
Speculators have now built the largest net short position on the CBOE Volatility Index (VIX) futures since 2022, signaling a broad market belief that volatility will stay low.
According to the latest Commitment of Traders (COT) report, non-commercial traders held net short positions of -92,787 VIX futures contracts as of Aug. 19. That's the most aggressive bet against volatility in nearly three years.

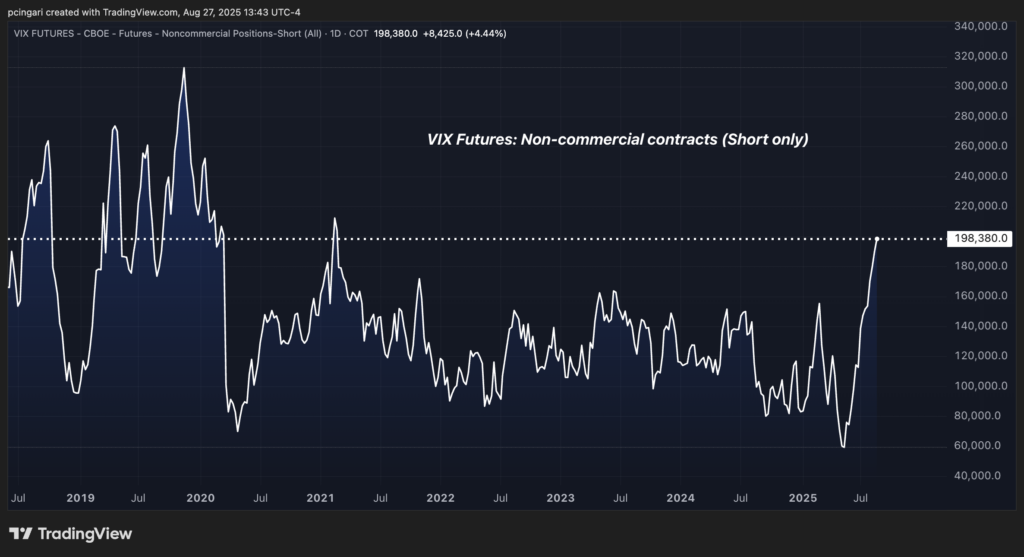
Drilling deeper, short VIX contracts have ballooned to 198,380 contracts—a level not seen since February 2021. Just four months ago in May, that figure was down to 59,248, the lowest since early 2012. Meanwhile, long positions have remained relatively stable at 105,593, flat from mid-April and July levels.
That sharp build-up means speculators are positioning for smooth sailing ahead—at exactly the moment when seasonal and event-driven risks are piling up.

Nvidia's Earnings Could Be A Market Catalyst
The most immediate catalyst that could disrupt this low-volatility narrative is Nvidia's second-quarter earnings, due Wednesday after the close.
The chipmaker is now the single most important company in the world by influence, boasting a $4.4 trillion market cap. If Nvidia misses expectations or disappoints with its guidance, its fall alone could spark a domino effect across the tech sector and the broader market.
Given Nvidia's outsized role in driving recent gains—particularly in AI-related sectors—a negative surprise could unwind part of the broader rally seen since April.
Here Comes September: The Worst Month For Stocks
Even if Nvidia clears the earnings bar, seasonality presents another threat.
September has long held the title as the worst-performing month for equities.
Over the last 10 years, the S&P 500 has averaged a loss of 1.96% in September, with September 2022 ranking as the second-worst month of the past decade—behind only March 2020.
Stretch the lookback to 30 years, and September still stands out, with the S&P delivering an average return of -0.65%, the weakest of any calendar month.
But VIX Loves September
If stocks tend to suffer in September, the VIX tends to shine.
The so-called “fear gauge” has posted average gains of 5.6%, 8.32% and 8.22% over the past 10, 20 and 30 years, respectively, during the month of September.
The standout? September 2008, when the collapse of Lehman Brothers sent the VIX soaring 91% in a single month.
But you don't have to go that far back to find elevated VIX moves: in each of the past four Septembers, the VIX has posted double-digit gains of 40.3%, 22.2%, 29.1% and 11.39%, respectively.
| September | VIX % | S&P 500 % |
|---|---|---|
| 2005 | -5.40% | 0.69% |
| 2006 | -2.68% | 2.46% |
| 2007 | -23.01% | 3.58% |
| 2008 | 90.75% | -9.08% |
| 2009 | -1.54% | 3.57% |
| 2010 | -9.02% | 8.76% |
| 2011 | 35.86% | -7.18% |
| 2012 | -9.96% | 2.42% |
| 2013 | -2.41% | 2.97% |
| 2014 | 36.14% | -1.55% |
| 2015 | -13.82% | -2.64% |
| 2016 | -0.97% | -0.12% |
| 2017 | -10.20% | 1.93% |
| 2018 | -5.75% | 0.43% |
| 2019 | -14.44% | 1.72% |
| 2020 | -0.15% | -3.92% |
| 2021 | 40.27% | -4.76% |
| 2022 | 22.24% | -9.34% |
| 2023 | 29.13% | -4.87% |
| 2024 | 11.39% | 2.02% |
| Average | 8.32% | -0.65% |
Are Traders Underestimating the Risk?
With short VIX positions near record highs and historical patterns flashing red, the risk of a short squeeze has rarely been higher.
A sharp spike in the VIX—triggered by Nvidia, economic data, or geopolitical tensions—could force those holding short positions to cover quickly, exacerbating market volatility in the process.
That's the paradox: the more confident traders are in market calm, the greater the risk becomes if something—anything—goes wrong.
Read Next:
Photo: Shutterstock


