Virgin Galactic (SPCE Get Virgin Galactic Report is known for extreme volatility in both directions. Shares have explosive tendencies on both the upside and the downside.
While it’s a mixed day in the stock market on Monday, shares of Virgin are trying to make a push back to positive territory.
The stock is down 3% on the day at last check, but that’s much better than where it stood earlier, when it was down over 6%.
The latest decline comes as the company’s test flight for the Italian Air Force was delayed.
Shares exploded higher on June 25, rallying almost 40% in a single day when Virgin Galactic received its license from the FAA for commercial space launches.
However, those gains could not be sustained as Virgin eventually turned lower. It hasn’t been a great ride for others either, with Boeing (BA Get Boeing Company Report and Lockheed Martin (LMT Get Lockheed Martin Corporation (LMT) Report also struggling over the last several months.
Let’s look at the chart.
Trading Virgin Galactic Stock
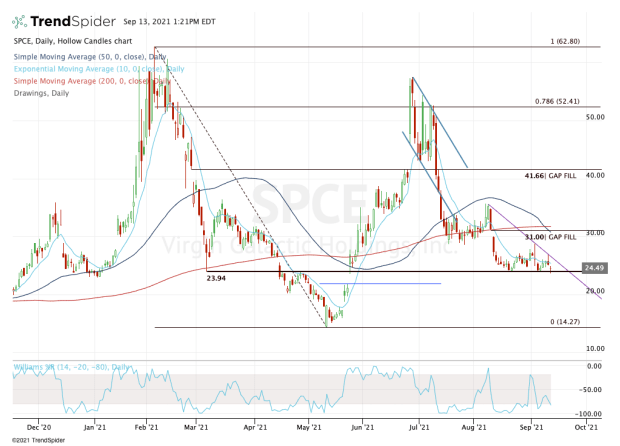
Chart courtesy of TrendSpider.com
When Virgin Galactic stock exploded higher in February, it topped out at $62.80, just shy of the 161.8% extension at $63.15. For most traders — myself included — this is considered close enough.
Shortly after that, growth stocks entered a painful bear market while the indices continued to chug higher. That bear market didn’t end until early May.
That was a key moment for Virgin stock, as it cratered below the key $24 level. More specifically, that level is $23.94, but let’s just stick with $24 for simplicity.
After another burst higher, bulls find themselves again hoping that this level can hold as support. The only problem? Virgin Galactic stock is trending lower.
It’s below all of its major daily moving averages while downtrend resistance (purple line) continues to squeeze it lower.
This setup — known as a descending triangle — is a bearish technical pattern.
For now though, Virgin stock continues to hold up above this level. If it can reclaim the 10-day moving average and push through downtrend resistance, bulls have a chance to buck the bearishness and drive Virgin Galactic stock higher.
In that scenario, it would have me immediately looking at the 50-day moving average, followed by the 200-day moving average and the gap-fill level at $31.
On the downside, a close below $23.94 or a move below Monday’s low at $23.58 will fire up the short-sellers and have them targeting the $21.50 level, followed by $20, then $17.
The bottom line is simple: Keep an eye on $23.94. Or if you’d rather, $24.
Boeing is a holding in Jim Cramer's Action Alerts PLUS member club. Want to be alerted before Jim Cramer buys or sells BA? Learn more now.