
The Average True Range (ATR) is one of the simplest yet most powerful indicators for traders. It measures volatility — not direction — and can signal when markets are likely to break out or consolidate.
How to Use ATR to Track Market Volatility
In a recent live webinar, John Rowland, CMT, demonstrated how to find and apply ATR using Barchart tools. Here are some highlights from his breakdown.
Finding ATR on Barchart
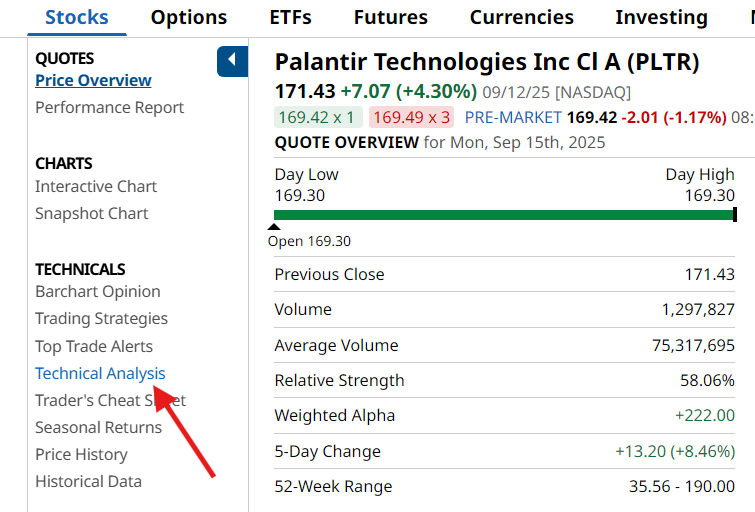
Start from any stock, ETF, or futures page - e.g., Palantir (PLTR).
Click the “Technical Analysis” menu on the left.
View multiple ATRs (9-day, 14-day, 20-day, 50-day).
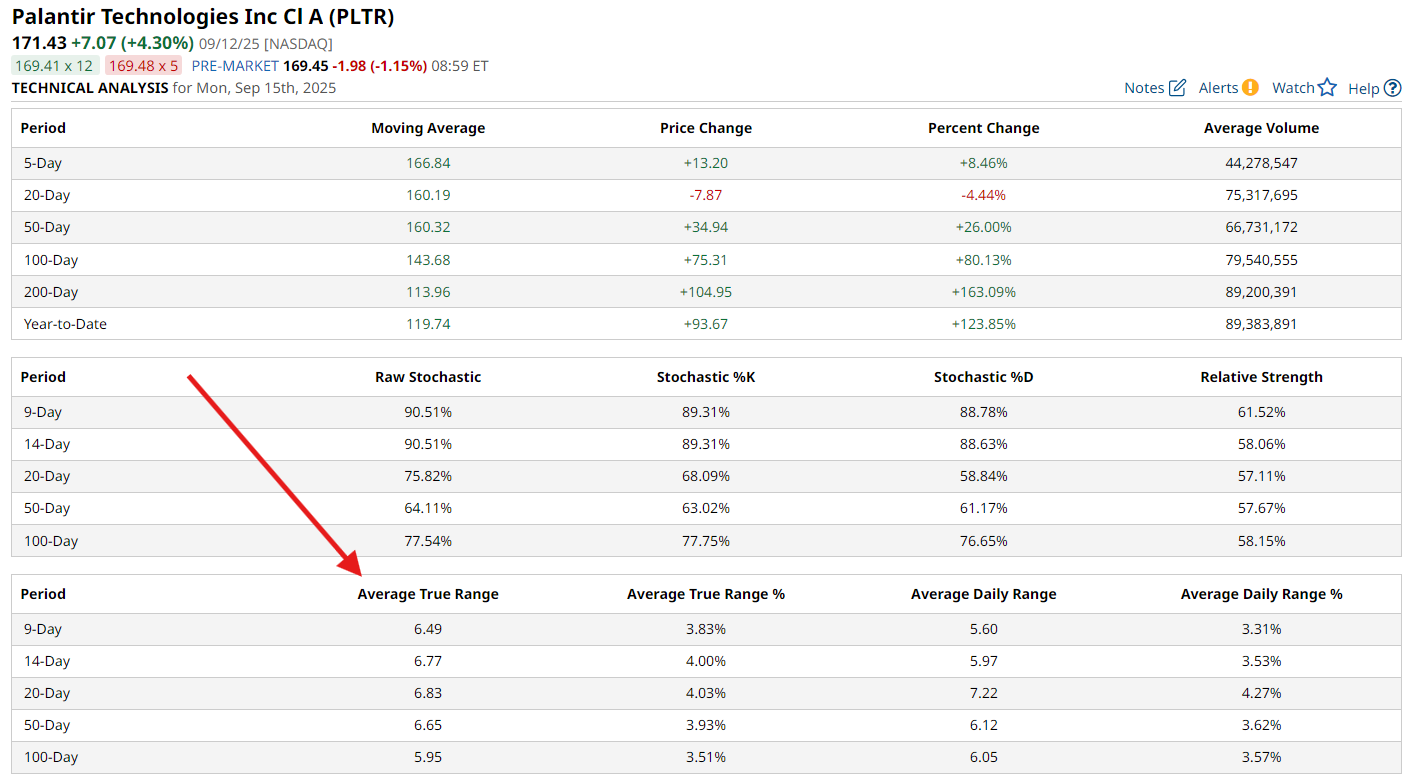
Quick tip:
- Day traders often use shorter ATRs (9-day).
- Swing traders typically look at 14- or 20-day time frames.
- Long-term investors may focus on the 50- or 100-day ATR.
This overview also gives a quick visual snapshot of whether volatility is rising or contracting, which can hint at upcoming consolidations or expansions.
Interactive Charts
To add ATR to your stock or ETF chart, open Indicators > Standalone Studies → Average True Range.
- Default is 14-period, but settings can be adjusted.
- ATR can also be smoothed with moving averages.
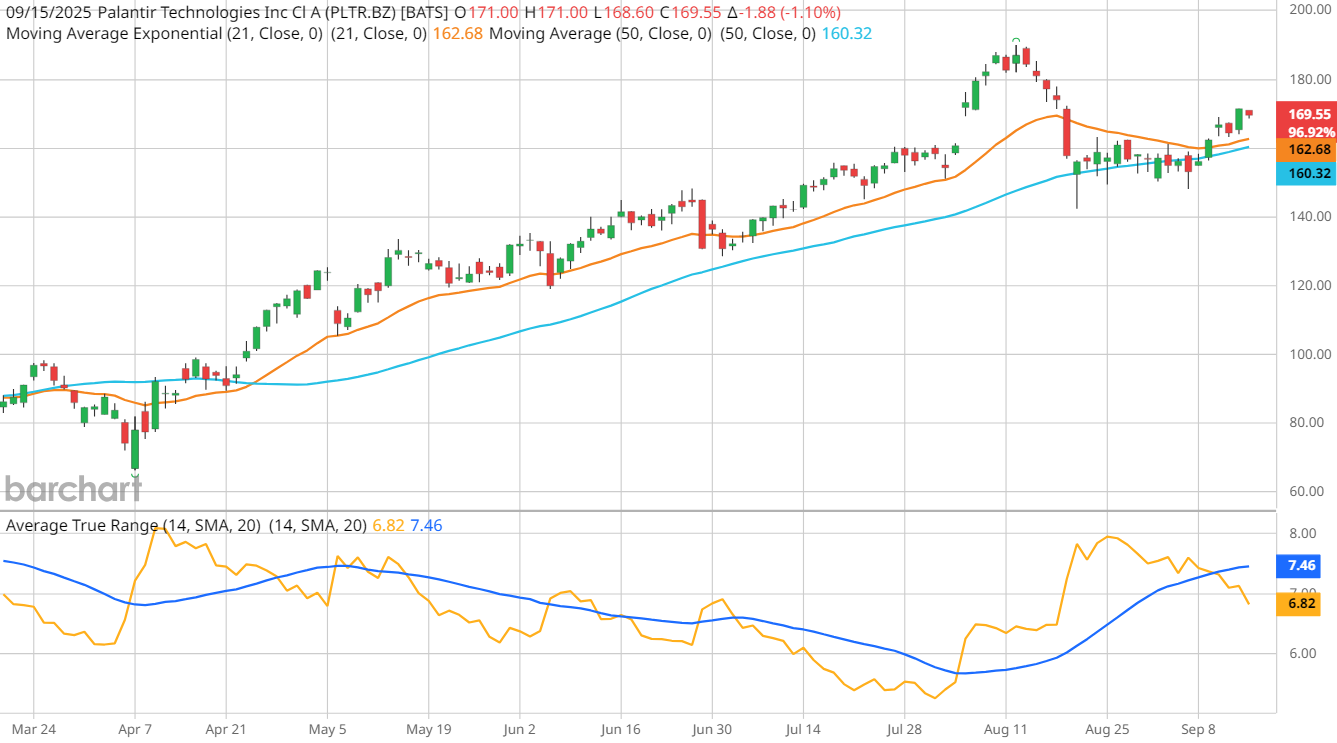
In John’s example of the S&P 500 ($SPX), ATR was decreasing — signaling that volatility was coming out of the market, which often precedes a breakout.
Why ATR Matters
- Position Sizing → Traders use ATR to set stop losses relative to volatility.
- Breakout Signals → Falling or low ATR can mean volatility is about to expand.
- Market Context → Rising ATR = high volatility environment; contracting ATR = quieter market.
How to Apply ATR with Barchart Tools
- Use Interactive Charts to customize ATR and overlay it with other indicators.
- Check Technical Analysis on futures/equity pages for quick ATR values.
- Combine ATR with the Earnings Calendar to anticipate where volatility may spike.
Bottom Line
ATR doesn’t predict direction, but it’s one of the best ways to measure whether a market is heating up or cooling off. For day traders, swing traders, and long-term investors alike, it’s an essential tool to keep on watch.
Catch the full webinar replay with John Rowland on ATR, and sign up for email notifications so you don’t miss our next live trading webinar.