A side from wins and losses, attendance maybe the most meaningful measurement of how well a college football team is doing in a season.
Healthy ticket sales reflect a team’s on-the-field success in a given season, but they also pay the bills for a substantial share of an athletic department’s expenses.
However, a game’s reported attendance number doesn’t always tell the whole story of a program’s success or failure. Athletic department budgets vary, and a number that foots the bill for one school may not cut muster for another.
Washington State will never fit 60,000 fans in its 33,000-seat venue, but selling out Martin Stadium every game in a season will likely do more for the WSU athletic department than the same 33,000 weekly attendance figure would do for Washington or USC.
Consequently, the attendance tables below show each team’s attendance by total and as a percentage of capacity.
The tables display the stadium capacities for all 25 SuperWest teams, along with a running summation of attendance totals and averages for the 2025 season, as well as weekly totals for each week of the season.
(Hawai’i is temporarily playing in TC Ching’s Athletic Complex until the New Aloha Stadium Entertainment District is completed.)
2025 Season Running Totals and Averages
Team
Homes Games
Total Attendance
Average Att
% Capacity
Oregon
5
291,659
58,332
108%
BYU
4
257,897
64,474
104%
Colorado
6
309,936
51,656
103%
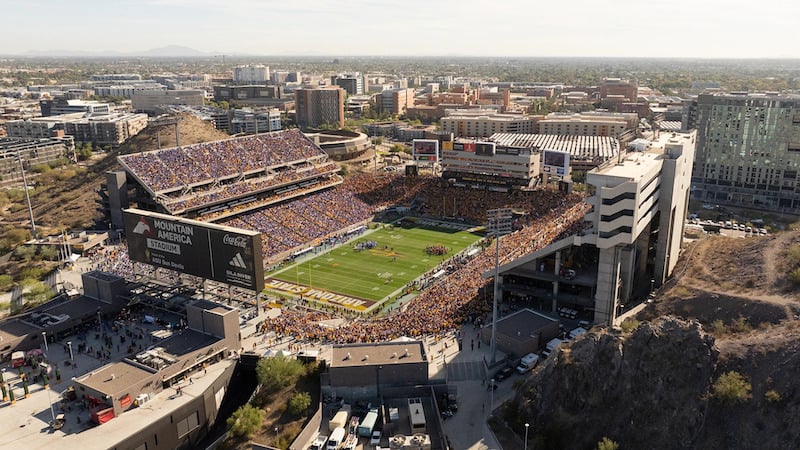
ASU
5
272,971
54,594
102%
Utah
5
258,764
51,753
101%
Boise State
5
164,526
32,905
100%
Washington
5
338,057
67,611
96%
Fresno State
4
155,551
38,888
95%
CSU
5
169,461
33,892
93%
Wyoming
5
114,949
22,990
90%
USC
4
272,469
68,117
88%
WSU
4
113,171
28,293
86%
Ore St
6
179,386
29,898
84%
Arizona
5
211,157
42,231
83%
Hawai'i
5
65,567
13,113
77%
SDSU
4
105,337
26,334
75%
Air Force
5
139,772
27,954
71%
Utah State
4
72,555
18,139
71%
SJSU
4
56,153
14,038
65%
Nevada
4
74,845
18,711
62%
New Mexico
4
93,409
23,352
60%
Cal
5
180,988
36,198
57%
UNLV
4
120,744
30,186
46%
Stanford
4
91,529
22,882
45%
UCLA
4
141,012
35,253
40%
Home Team
Opponent
Attendance
% Capacity
Air Force
Army
39,441
100%
Boise State
Fresno State
32,826
100%
Utah
Cincinnati
51,672
100%
Colorado
Arizona
48,322
96%
Oregon State
Washington State
32,905
93%
San Jose State
Hawai'i
16,012
74%
San Diego State
Wyoming
24,325
70%
Cal
Virginia
30,893
49%
UNLV
New Mexico
25,972
40%
Stanford
Pitt
16,540
33%
Home Team
Opponent
Attendance
% Capacity
Oregon
Wisconsin
58,940
109%
Fresno St
SDSU
41,535
102%
ASU
Houston
54,256
101%
Utah
Colorado
51,949
101%
Wyoming
CSU
25,609
100%
Washington
Illinois
68,630
98%
WSU
Toledo
27,646
84%
Nevada
Boise St
18,029
60%
New Mexico
Utah St
20,097
51%
Home Team
Opponent
Attendance
% Capacity
Colorado State
Hawai'i
40,416
111%
BYU
Utah
64,794
104%
ASU
Texas Tech
54,177
101%
Boise State
UNLV
32,927
100%
Utah State
SJSU
22,710
89%
Oregon State
Lafayette
27,735
78%
Air Force
Wyoming
23,401
59%
Cal
North Carolina
33,401
53%
Stanford
Florida State
26,470
52%
New Mexico
Nevada
18,233
46%
UCLA
Maryland
35,561
40%
Home Team
Opponent
Attendance
% Capacity
Oregon
Indiana
59,625
110%
Colorado
Iowa State
52,698
105%
Boise State
New Mexico
32,982
101%
Utah
ASU
51,444
100%
USC
Michigan
75,500
97%
Arizona
BYU
47,960
94%
Washington
Rutgers
63,743
91%
Oregon State
Wake Forest
29,710
84%
Hawai'i
Utah State
13,023
77%
Colorado State
Fresno State
27,874
76%
Wyoming
SJSU
20,970
72%
Nevada
SDSU
19,473
65%
UNLV
Air Force
32,932
51%
Home Team
Opponent
Attendance
% Capacity
BYU
West Virginia
63,917
103%
Fresno State
Nevada
40,005
98%
San Diego State
Colorado State
29,019
83%
Arizona
Oklahoma State
40,685
80%
Wyoming
UNLV
19,861
68%
Cal
Duke
42,240
67%
San Jose State
New Mexico
12,109
56%
UCLA
Penn State
39,256
44%
Home Team
Opponent
Attendance
% Capacity
Colorado
BYU
52,265
104%
Washington
Ohio State
72,485
103%
ASU
TCU
53,774
100%
Boise State
App State
32,904
100%
New Mexico
New Mexico State
37,440
95%
CSU
WSU
32,087
88%
Oregon State
Houston
29,338
83%
Stanford
SJSU
26,357
52%
Air Force
Hawai'i
22,677
49%
Week 4 Attendance
Home Team
Opponent
Attendance
% Capacity
Oregon
Oregon State
58,571
108%
Colorado
Wyoming
53,442
106%
Utah
Texas Tech
52,236
102%
WSU
Washington
32,952
100%
SDSU
Cal
31,369
90%
CSU
UTSA
32,061
88%
USC
Michigan State
67,614
87%
Hawai'i
Fresno State
13,789
81%
Utah State
McNeese
16,273
64%
SJSU
Idaho
13,155
61%
Air Force
Boise State
24,046
51%
Week 3 Attendance
Home Team
Opponent
Attendance
% Capacity
ASU
Texas State
54,005
101%
Fresno State
Southern
37,210
91%
Wyoming
Utah
23,500
81%
Arizona
Kansas State
40,051
79%
Hawai'i
Portland State
11,936
70%
Utah State
Air Force
17,124
67%
Cal
Minnesota
38,556
61%
Nevada
Middle Tennessee
16,808
56%
Stanford
Boston College
22,162
44%
UCLA
New Mexico
31,163
35%
Week 2 Attendance
Home Team
Opponent
Attendance
% Capacity
Oregon
Oklahoma State
57,266
106%
BYU
Stanford
64,692
104%
CSU
Northern Colorado
37,023
101%
Boise State
Eastern Washington
32,887
100%
Colorado
Delaware
50,341
100%
Utah
Cal Poly
51,463
100%
Washington
UC Davis
65,421
93%
USC
Georgia Southern
66,514
86%
Wyoming
Northern Iowa
25,009
86%
Arizona
Weber State
40,038
79%
Oregon State
Fresno State
28,068
79%
WSU
SDSU
24,330
74%
Hawai'i
Sam Houston
11,625
68%
Nevada
Sacramento State
20,535
68%
Cal
Texas Southern
35,898
57%
UNLV
UCLA
36,117
56%
New Mexico
Idaho State
17,639
45%
Week 0/1 Attendance
Home Team
Opponent
Attendance
% Capacity
Oregon
Montana State
57,257
106%
ASU
NAU
56,759
106%
Colorado
Georgia Tech
52,868
105%
BYU
Portland State
64,494
104%
Washington
CSU
67,778
97%
Fresno St
GA Southern
36,801
90%
Hawai'i
Stanford
15,194
89%
Oregon St
Cal
31,630
89%
WSU
Idaho
28,243
86%
Arizona
Hawai'i
42,423
84%
USC
Missouri State
62,841
81%
SJSU
Central Michigan
14,877
69%
Air Force
Bucknell
30,207
65%
Utah St
UTEP
16,448
64%
SDSU
Stony Brook
20,624
59%
UCLA
Utah
35,032
40%
UNLV
Idaho State
25,723
40%
Stadium Capacities
Team
Stadium Name
Capacity
Air Force
Falcon Stadium
39,441
Arizona
Arizona Stadium
50,800
ASU
Mountain America Stadium
53,599
Boise State
Albertsons Stadium
36,363
BYU
LaVell Edwards Stadium
62,073
Cal
Memorial Stadium
63,000
Colorado
Folsom Field
50,183
Colorado State
Canvas Stadium
36,500
Fresno State
Valley Children's Stadium
40,727
Hawai'i
TC Ching's Athletic Complex
17,000
Nevada
Mackay Stadium
30,000
New Mexico
University Stadium
39,224
Oregon
Autzen Stadium
54,000
Oregon State
Reser Stadium
35,548
San Diego State
Snapdragon Stadium
35,000
San Jose State
CEFCU Stadium
21,520
Stanford
Stanford Stadium
50,424
UCLA
Rose Bowl
88,565
UNLV
Allegiant Stadium
65,000
USC
LA Coliseum
77,500
Utah
Rice-Eccles Stadium
51,444
Utah State
Maverik Stadium
25,513
Washington
Husky Stadium
70,138
WSU
Martin Stadium
32,952
Wyoming
War Memorial Stadium
25,500
[[See 2024 Season Attendance Totals ]]