I vividly remember a commercial with the tag line “leave off the last S for savings!” I had to look it up, but I found it. It was a 1992 ad for Dial-A-Mattress. And while that might not mean anything to most people, it reminds me of that era, where the S&P 500 Index ($SPX) was still taking a backseat to the Dow Jones Industrial Average ($DOWI). When the 1987 crash occurred, and the market fell by more than 22% in a single October day, the headlines screamed “Dow falls by 500 points.” If you had asked investors how the S&P 500 did, they would have responded predictably: “What’s the S&P 500?”
Fast forward to 2025, and 38 years post-crash, the S&P 500 is the reigning stock market indicator. But should it be? And if not, why?
I’ve written here recently that as few as 20 stocks at the top of the S&P 500 could be a good proxy for the full index. I noted that in my view, 450-480 of the stocks simply cancel each other out over time, or have such a small impact on that capitalization-weighted index, that investors could be forgiven for cutting to the punch line. Just look at the top 20 stocks, and you know what the market is doing. Forget the ankle-biters, even if they are 10x-20x greater in number.
I was thinking at the time about the ETF that has, for more than 20 years, been one of the best ways to invest in the S&P 500, but with much more insight into what you own. The Invesco S&P 500 Top 50 ETF (XLG) is now a $10 billion ETF.
Much of that $10 billion comes from inflows of capital from investors with a similar, simple idea: Capitalize on the persistent trend whereby the top 50 S&P 500 stocks outperform the rest.
XLG: Evidence That Diversification Can Only Go So Far
Conventional wisdom in investing would cause some to think that owning 500 stocks is way better than 50. In the case of this ETF, and generally, that is absolutely not accurate.
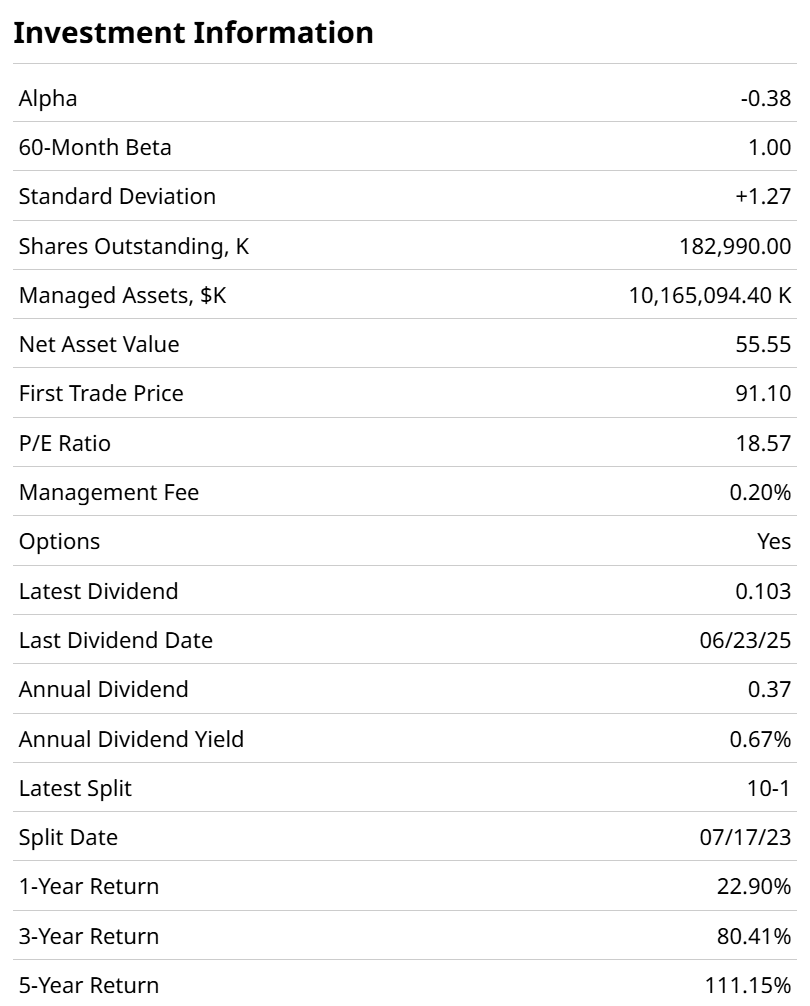
XLG’s 1.00 historical beta indicates that it is no more or less volatile than the S&P 500. And its portfolio of 50 (not 500) stocks trades at under 19x earnings, in the neighborhood of the more popular version of the index.
XLG’s outperformance of the more populated index over a long time frame has been an easy win for the one that shaves a zero off its holdings count. However, this is more a post-pandemic phenomenon, where the stock market’s biggest keep getting bigger.
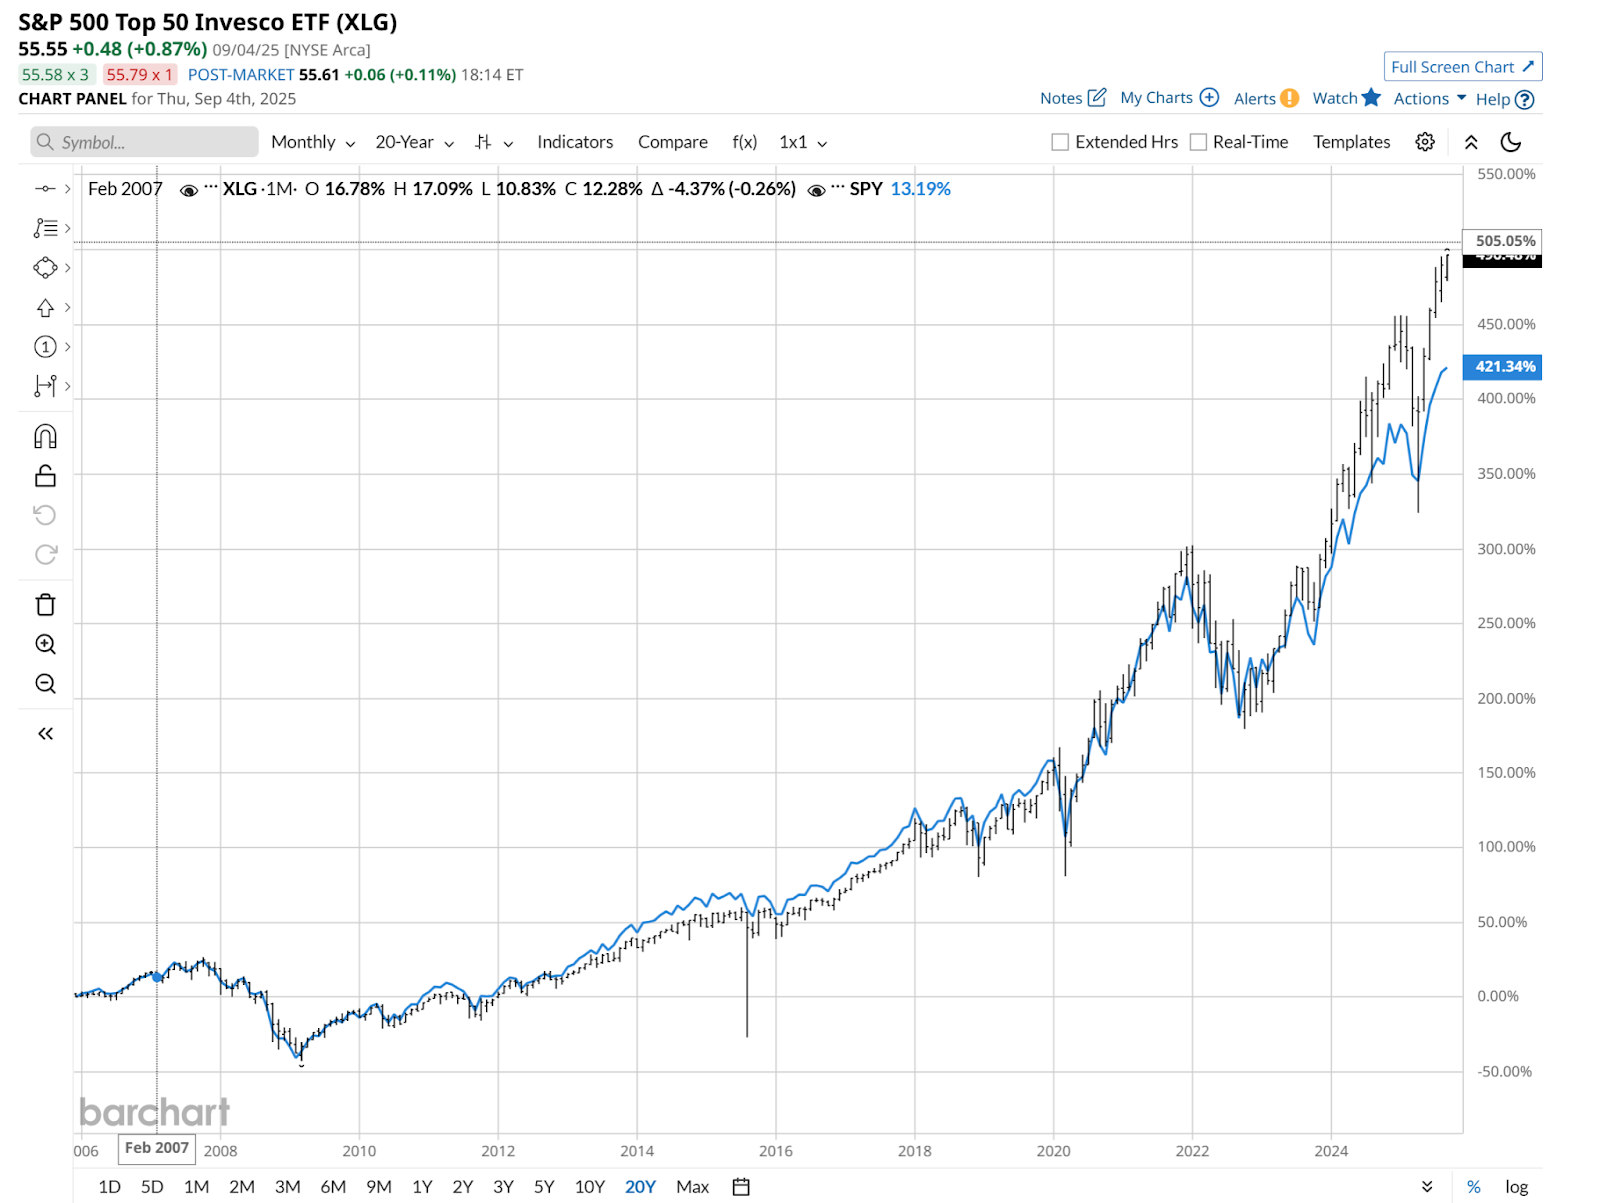
This trend could reverse hard at some point, but there’s no compelling reason for that to happen. Even if the market tanks, the flight to quality trade might just be in the most well-capitalized companies. The ones that used that competitive advantage to get to the top of the S&P 500, and that are big enough to be part of XLG’s exclusive 50-stock club.
Here are the top 33 stocks of XLG’s current basket. Ask yourself, if this were my portfolio of individual stocks, would I feel comfortable that I own mostly blue-chip companies, regardless of their valuation level? If so, XLG might be an alternative to that S&P 500 index fund you like so much.
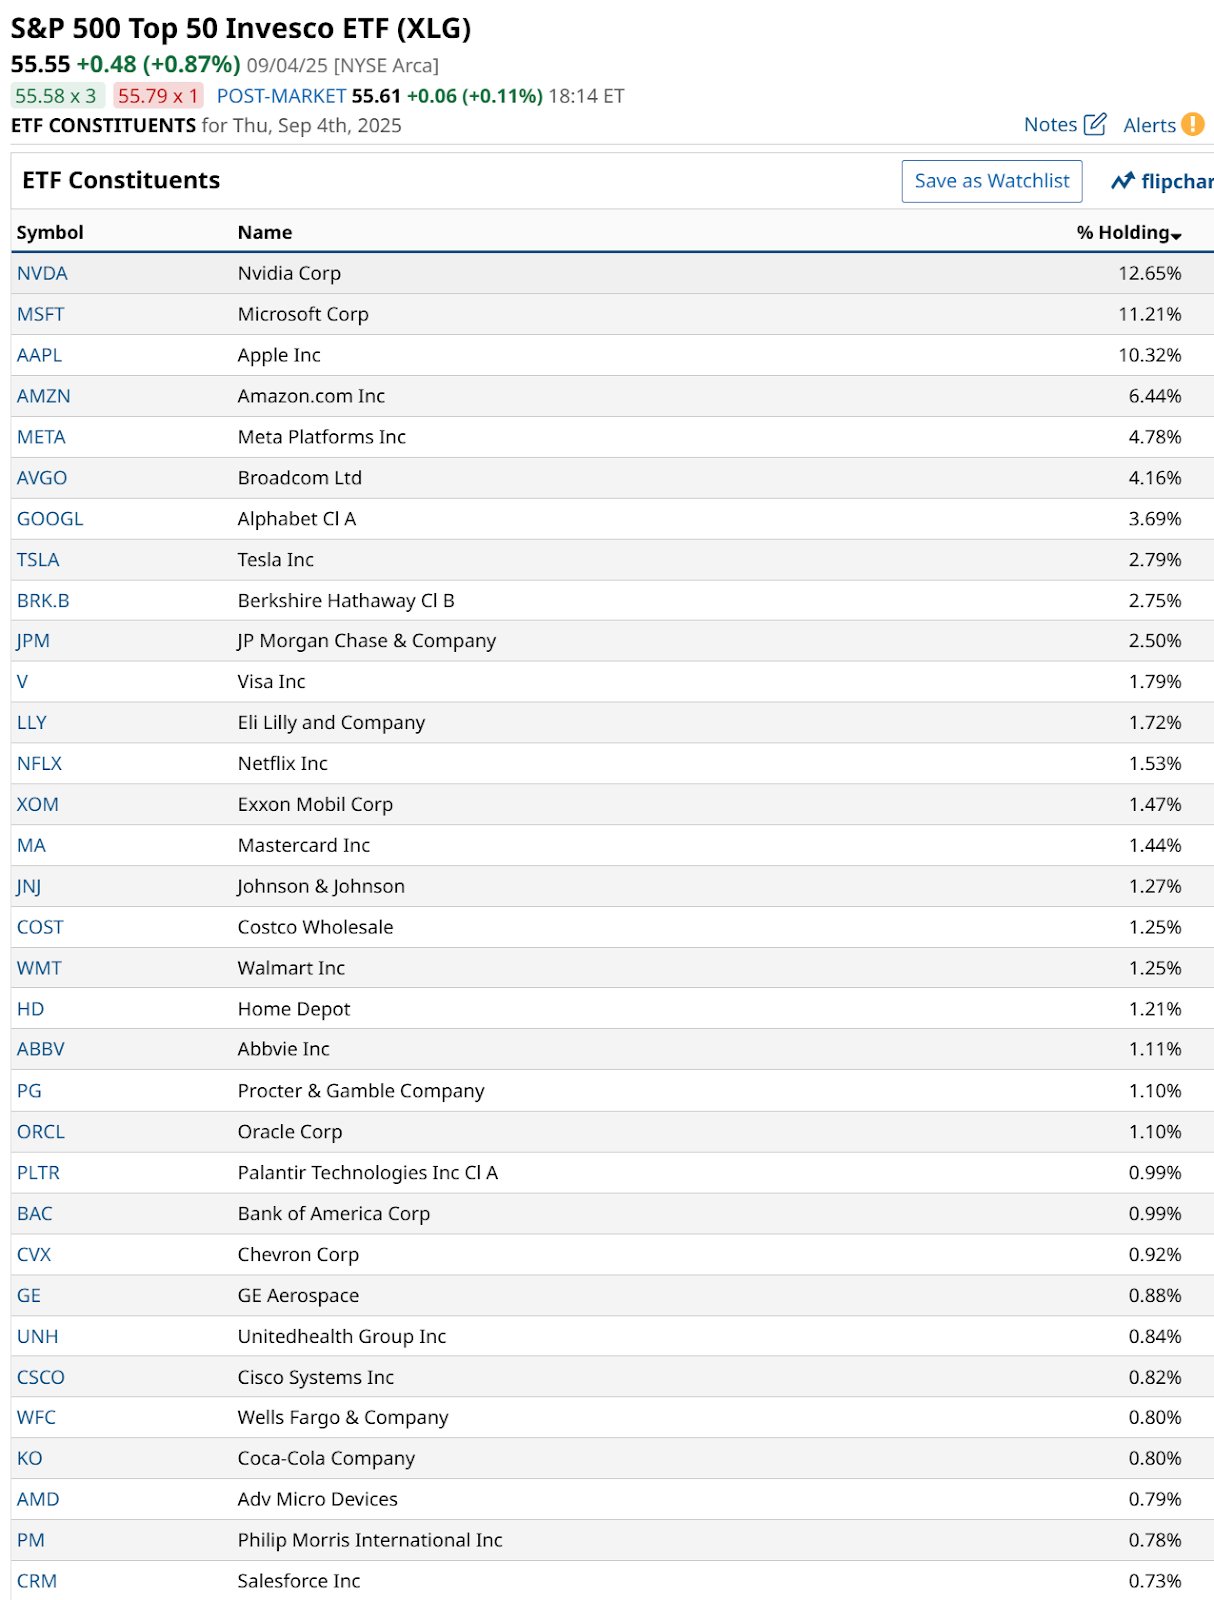
There is concentration risk in the U.S. large-cap space, and it is present here as well. 61% of this 50-stock ETF is in those top 10 companies. Iconic as they are, this is one of those things that will either persist much longer than anyone could expect, or it will flame out and leave everyone saying “that was so predictable.” This is why the time horizon, and your willingness to take an S&P 500-style ETF and emphasize the big guys in it is what a decision to explore XLG is about.
How to Trade the XLG ETF with Options
Yes, you can collar XLG, but the volume and open interest is not very high. This is often the case with these relatively lesser-known ETFs. So instead, let’s look at a more realistic scenario for using options on XLG.
For me, that would be a way to, at the margin, hedge an S&P 500 portfolio, but with the goal of focusing more of the hedge on the very biggest names. So if as in some past market dips, the Magnificent 7 led the index lower, XLG would likely fall more than the S&P 500 index would. A put position on XLG can be a potential way to capitalize on that.
While there was no volume on this XLG put contract (struck at $55, out to 12/19/2025), on Thursday, there’s 368 contracts of open interest. So I’m not the only one who has considered this trade.
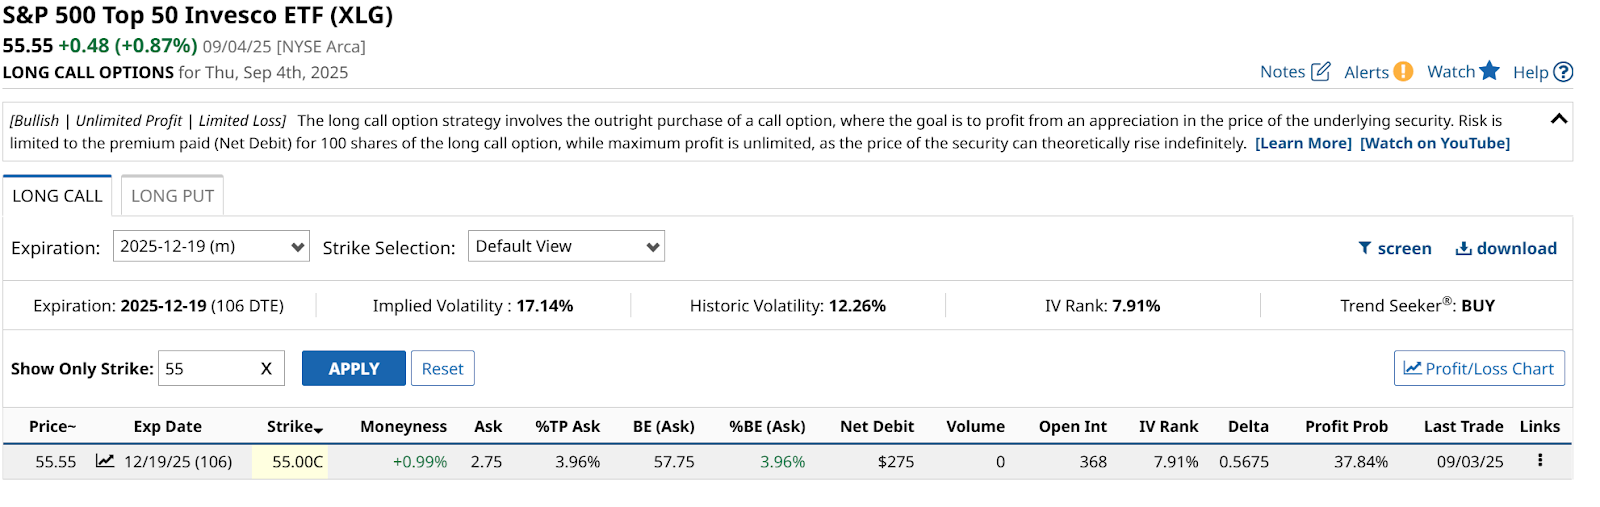
Doing so would cost 4% of Thursday’s closing price ($2.75 a contract, each contract representing 100 shares). If XLG were to fall just a bit over the next few months, this will end up in the money. And as shown above, the IV Rank is only around 8%. That means we are currently seeing close to the lowest volatility in XLG in the past 12 months. Low volatility doesn’t make covered call options attractive. But for puts, it’s a big factor in identifying higher risk-reward tradeoffs.
When considering which S&P 500 ETF you want to add to your portfolio, don’t be afraid to go for a shave. As I hope you’ve learned, for instance, the XLG ETF could be a slightly higher risk, higher return, and hedgeable alternative.