The Sopranos first aired on television. The Blair Witch Project was in theaters. Y2K scared us, but it was just fine. And this new music-sharing service started. It was called Napster. This was 1999. And while we were entertained by all of those pop culture happenings, the main event was the stock market.
The Invesco Nasdaq 100 ETF (QQQ) was the center of attention, just as it is today. Some of the businesses leading it back then are still around. Some are among the Magnificent 7 stock giants. Others are simply still in business. And many others are defunct.
Is the Stock Market in 2025 Like the Market in 1999?
OK, enough history. What does that have to do with today? Answer: EVERYTHING!
Because while no two eras of market history are identical, the list of similarities is too long to list here. The big ones include:
- Giant tech stocks capture the imagination of investors, to the point where they are their own type of “too big to fail.” While corporate failure is not a realistic consideration for multitrillion-dollar market cap stocks, a steep slide in their stock prices is always possible.
- A very concentrated market at the top. Even within QQQ’s 100 stocks, only 10 of them account for 52% of the weighting. The top five of those represent 38% of QQQ. And 20 stocks cover nearly half of the S&P 500 Index ($SPX). It is crowded at the top. Market leadership is nice, but history is littered with this type of stock market behavior that ultimately turned south.
- Massive confidence on the part of retail investors. Some of that could be disguised as FOMO, but the fact is, buying the dip is the only way many investors have ever participated in the market.
- Margin calls just waiting to happen. The system has held tight thus far. However, warning signs are popping up every week.
The QQQ ETF did not even start until the tech-mania of the 1990s was already in high gear. From its early 1999 inception, it doubled into March 2000. Only to give it all back 12 months later. And, to finally bottom at less than half its starting value, and not until late in 2002.
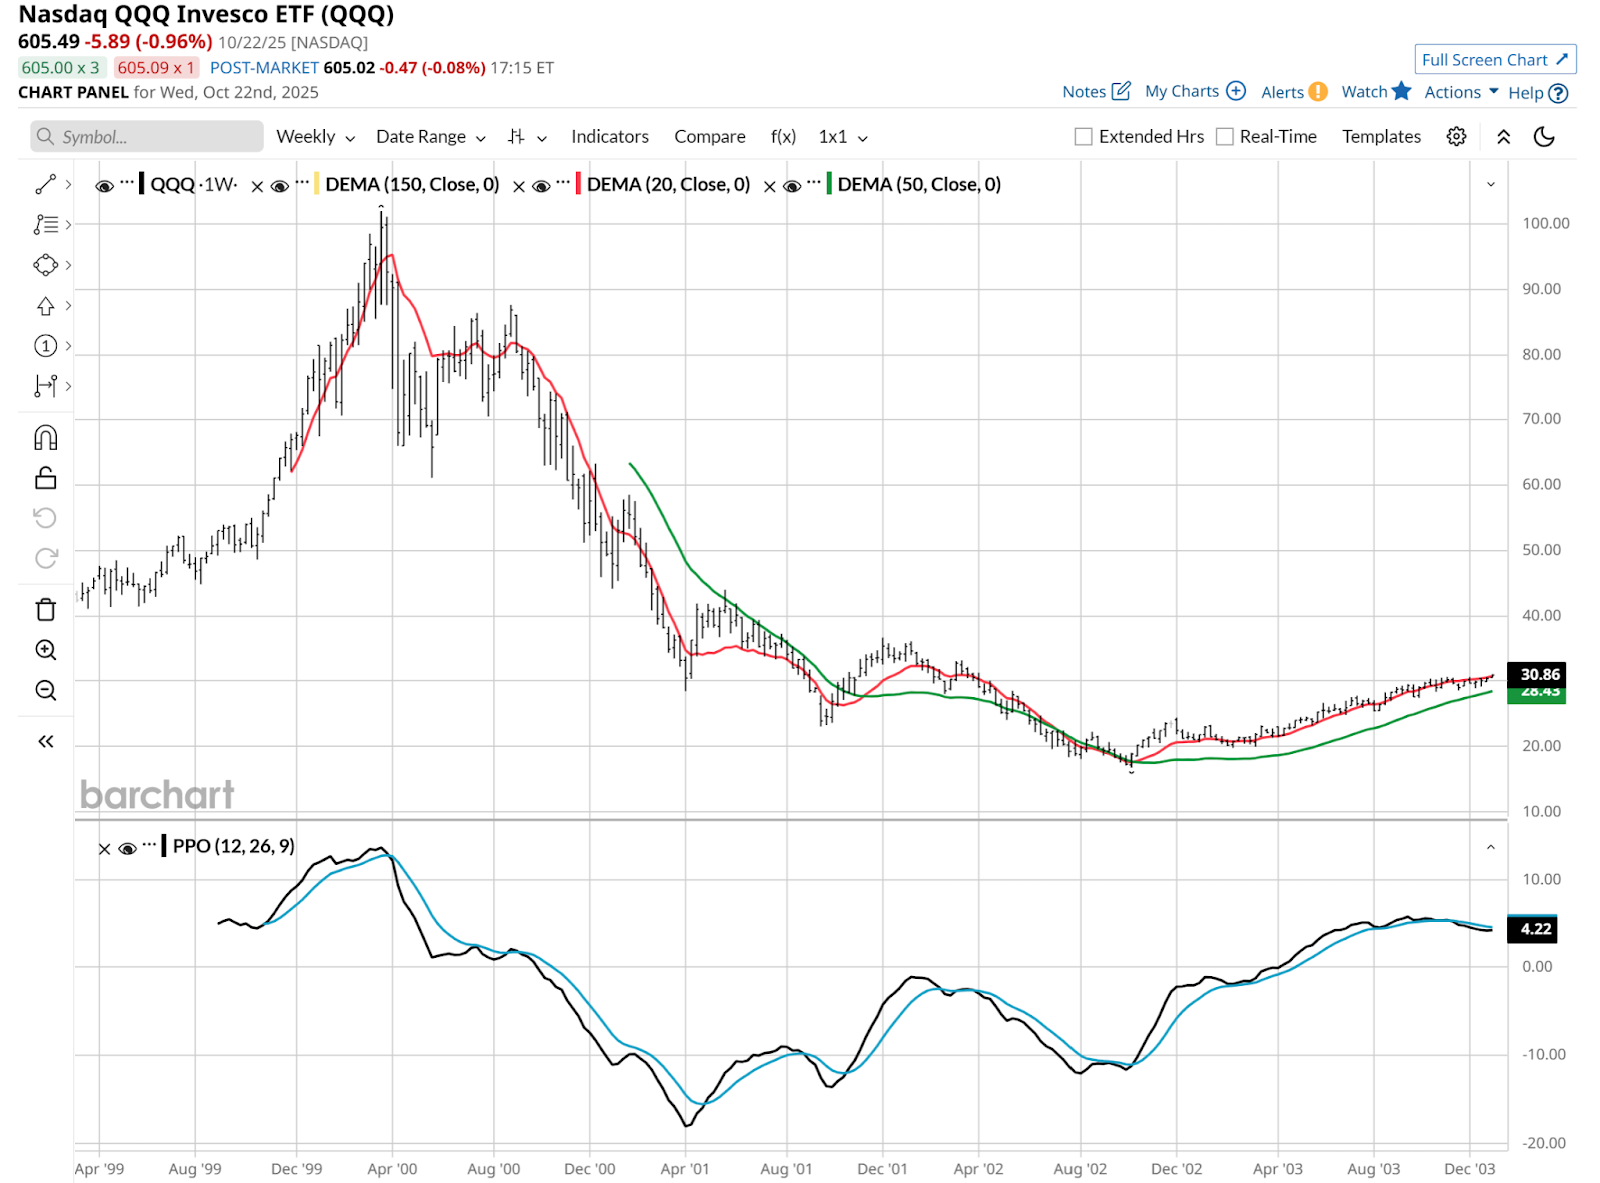
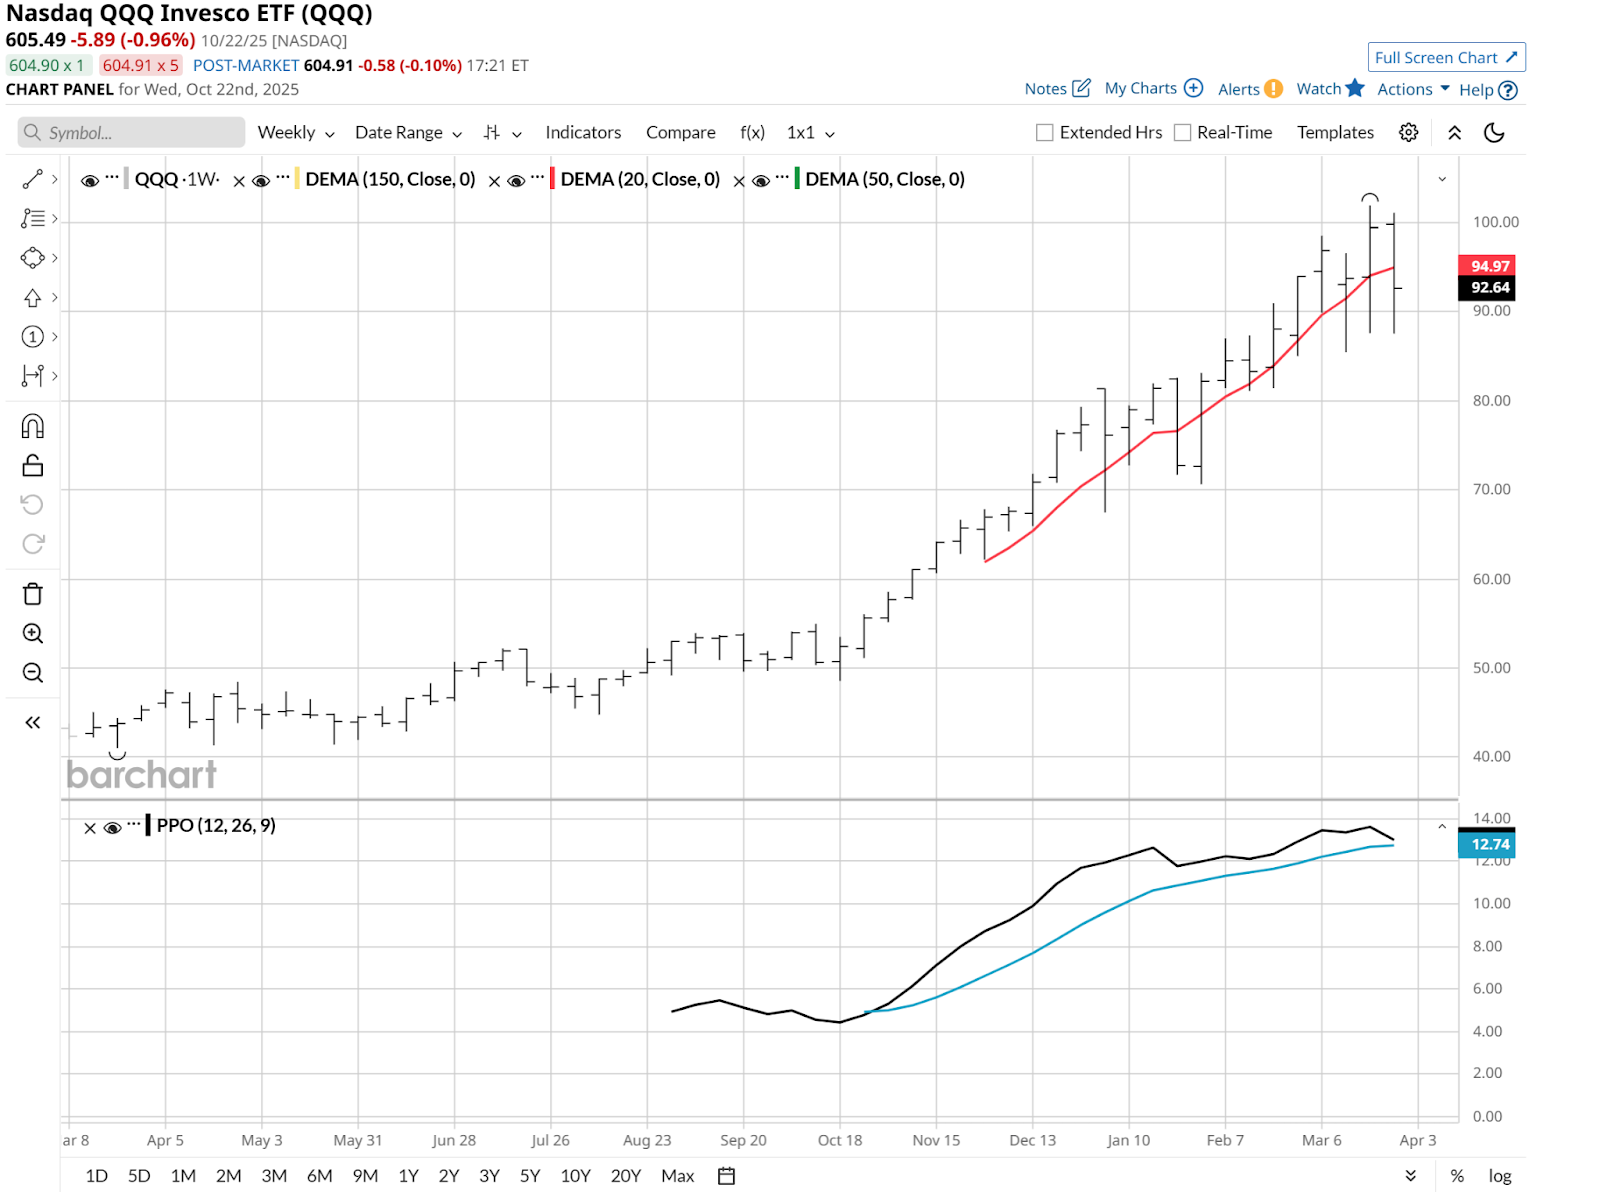
Given the timing of QQQ’s launch late last century, a weekly chart of its 1999-2000 climb is not a complete picture. But the tail end of it is shown here, in isolation.
Now, take a look at QQQ’s weekly pattern and the Percentage Price Oscillator (PPO) indicator as it has developed over the past 12 months. Excluding the hiccup caused by the March-April “tariff tantrum,” that chart has a similar vibe to me, versus the turn of the century period above.
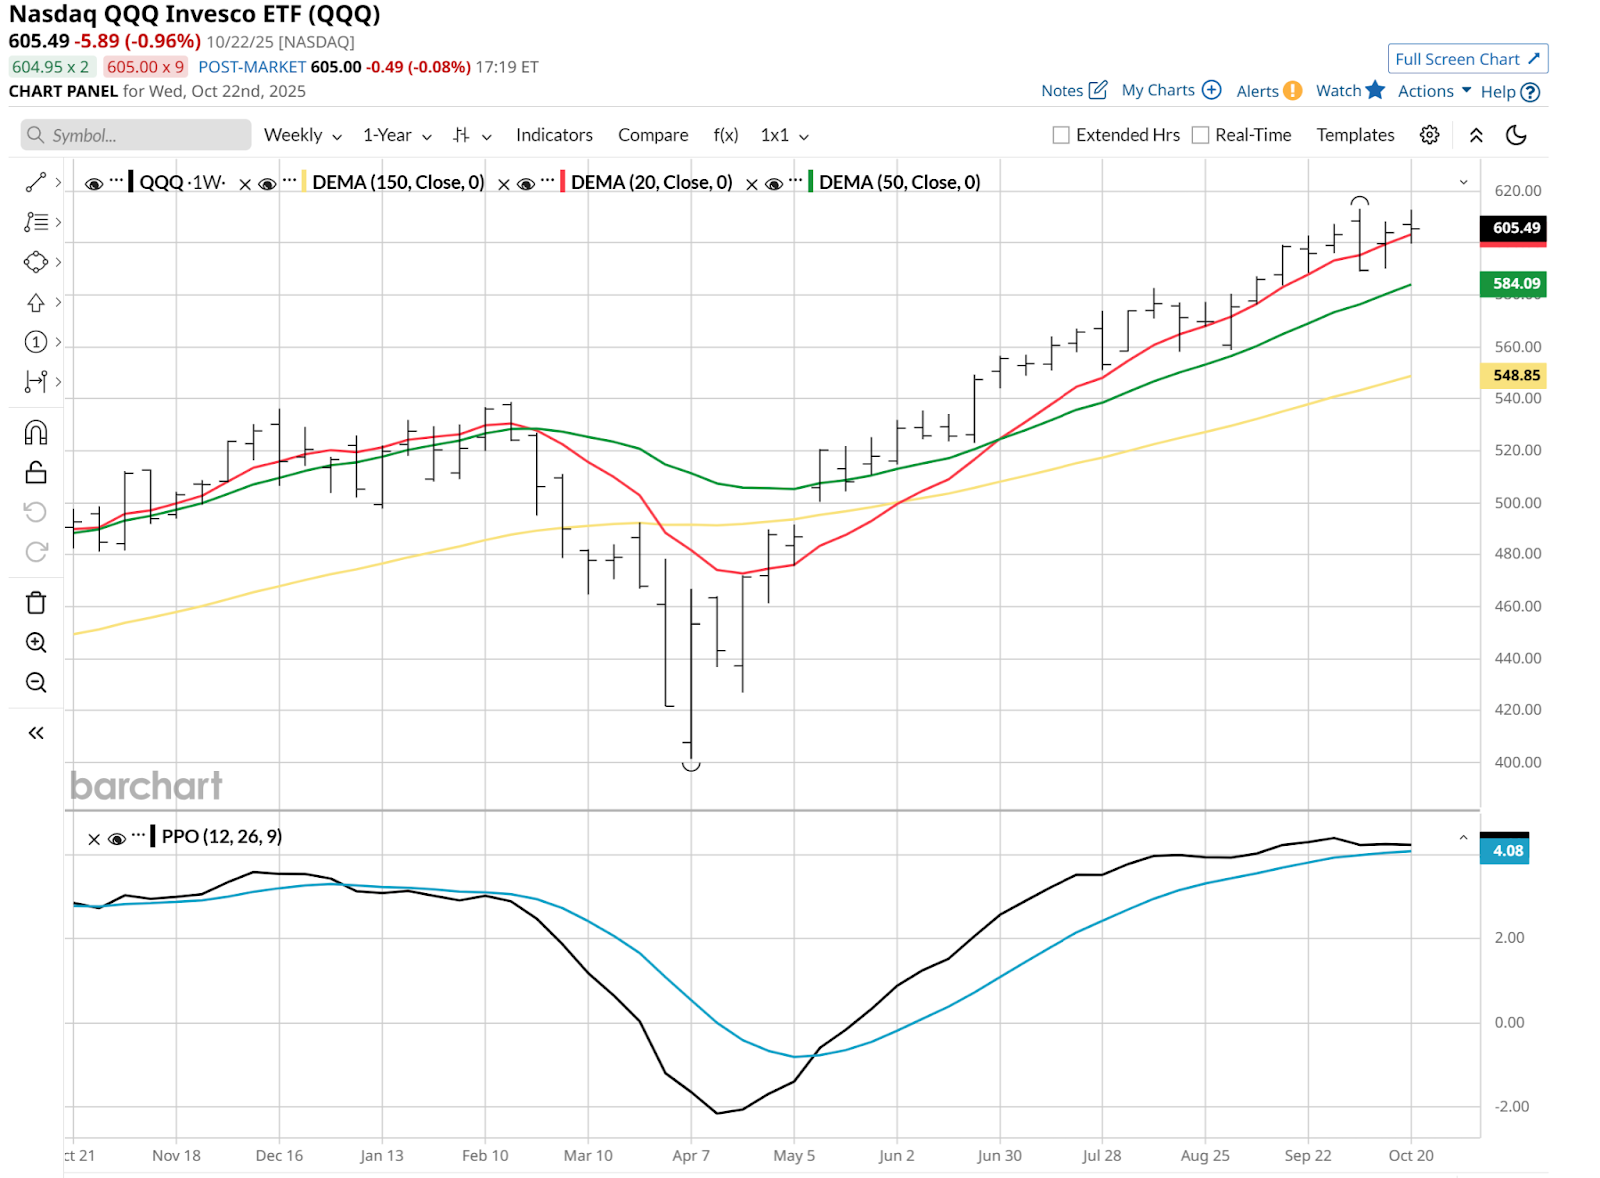
I don’t think this is a coincidence. But it is also not a perfect timing indicator. It does, however, make us reconsider just how “all-in” we want to be, knowing that QQQ’s history includes periods like 1999-2000.
So, what can you do if you’re concerned? While that is a personal decision, a few “pro tips” that come to mind include:
- Position-sizing. You may love your QQQ, but with all you have made on it, do you need to own this much?
- Hedging. Options, inverse ETFs, including those with leverage, and ETFs that hedge using volatility, are just three ways to take the edge off.
This is less about what to buy now, and more about how to play offense and defense at the same time. Or, in pop culture terms, you can party like it’s 1999, as long as you know how to get home safely.
Rob Isbitts, founder of Sungarden Investment Publishing, is a semi-retired chief investment officer, whose current research is found here at Barchart, as well as on Substack.