
You might have some familiarity with the nation’s 50 wealthiest suburbs, as ranked by GOBankingRates in July 2025. But what about the wealthiest suburbs in the 50 largest U.S. metros — such as Miami, Los Angeles and New York?
Discover More: GOBankingRates Original Research Center
View Next: The 5 Car Brands Named the Least Reliable of 2025
For this study, GOBankingRates used the U.S. Census 2023 American Community Survey to find the 50 largest metropolitan areas by population and identify the cities with the highest average household incomes within each Metropolitan Statistical Area (as defined by the Census).
Qualifying suburbs must have a minimum of 5,000 households and not be principal cities. Each suburb’s 2022 and 2023 household mean incomes were sourced and the CPI inflation calculator was used to find the 2022 household mean income’s value in 2023. The Zillow Home Value Index was referenced to source each suburb’s average single-family home value in 2025. The one-year change in dollar amount and percent was calculated for the inflation-adjusted household mean income and the single-family home value. The rankings for each suburb are based on population, with the most populated MSA first.

Key Findings
- Scarsdale, which ranked as the wealthiest suburb in the nation, is obviously therefore the wealthiest suburb in New York City. Over the course of one year, the household mean income in Scarsdale increased by 2.45% while home values went up by 4.60%.
- The wealthiest suburbs in the five biggest cities are Scarsdale (New York City), Palos Verdes Estates (Los Angeles), Hinsdale (Chicago), University Park (Dallas) and West University Place (Houston).
- The wealthiest suburbs in the Midwest have average incomes of $161,000 on the low end (Mason, Ohio) and as high as $376,000 (Hinsdale).
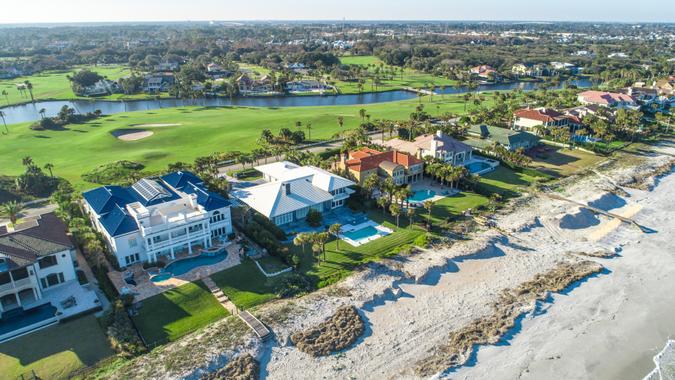
- Four Florida suburbs ranked in the top 50 with average incomes above $180,000: Pinecrest (#9), Keystone (#18), Lake Butler (#22) and Nocatee (#39).
Here are the wealthiest suburbs in the 50 largest metropolitan areas in the United States, ranked by population.
Find Out: I Asked ChatGPT If a Recession Is Coming Soon — Here’s What It Said
Learn More: Here’s How Much Every Tax Bracket Would Gain — or Lose — Under Trump’s ‘Big, Beautiful Bill’

1. Scarsdale, New York
- Suburb of: New York City (19.8 million)
- Household mean income 2023: $601,193
- Household mean income 1-year growth change (%): 2.45%
- Average home value June 2025: $1,607,856
- One-year home value change (%): 4.60%
That’s Interesting: J.P. Morgan Offers 3 Reasons the US Dollar Is Losing Value — and Why It Might Be Good for Your Wallet

2. Palos Verdes Estates, California
- Suburb of: Los Angeles (13 million)
- Household mean income 2023: $367,178
- Household mean income 1-year growth change (%): 3.96%
- Average home value June 2025: $2,777,130
- One-year home value change (%): -0.16%
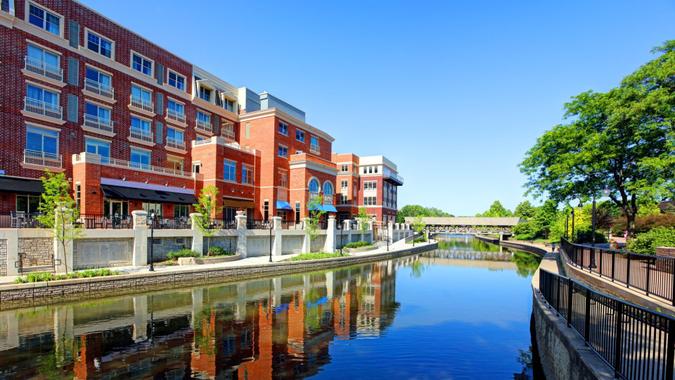
3. Hinsdale, Illinois
- Suburb of: Chicago (9.4 million)
- Household mean income 2023: $376,366
- Household mean income 1-year growth change (%): -4.09%
- Average home value June 2025: $1,259,123
- One-year home value change (%): 8.09%
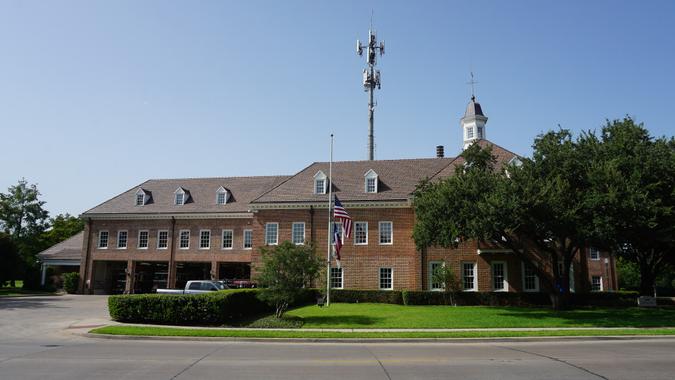
4. University Park, Texas
- Suburb of: Dallas (7.8 million)
- Household mean income 2023: $389,868
- Household mean income 1-year growth change (%): -0.85%
- Average home value June 2025: $2,432,712
- One-year home value change (%): 4.14%
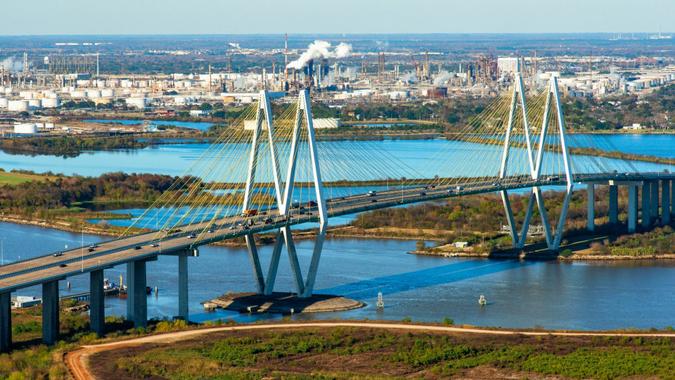
5. West University Place, Texas
- Suburb of: Houston (7.3 million)
- Household mean income 2023: $409,677
- Household mean income 1-year growth change (%): -1.64%
- Average home value June 2025: $1,102,617
- One-year home value change (%): 4.27%

6. McLean, Virginia
- Suburb of: Washington, D.C. (6.3 million)
- Household mean income 2023: $364,591
- Household mean income 1-year growth change (%): -2.91%
- Average home value June 2025: $1,726,735
- One-year home value change (%): 5.36%
Explore More: Here’s How Much Cash You Need Stashed To Survive a Recession in the Midwest
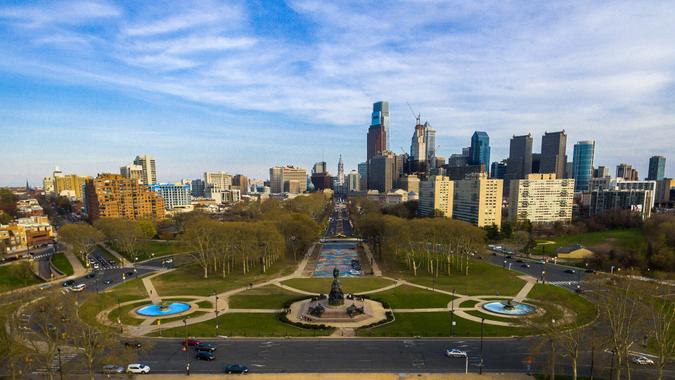
7. Ardmore, Pennsylvania
- Suburb of: Philadelphia (6.2 million)
- Household mean income 2023: $161,029
- Household mean income 1-year growth change (%): -5.80%
- Average home value June 2025: $527,016
- One-year home value change (%): 2.02%
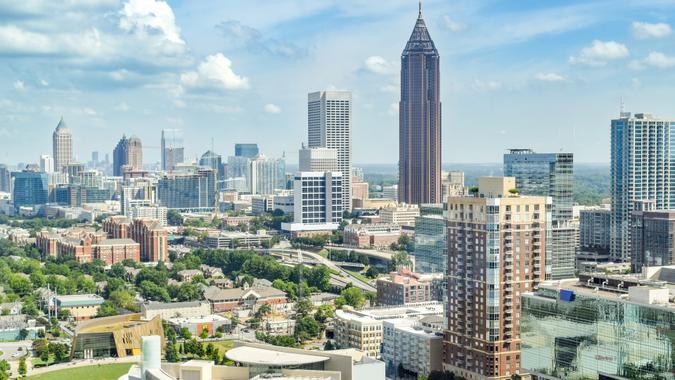
8. Milton, Georgia
- Suburb of: Atlanta (6.2 million)
- Household mean income 2023: $225,532
- Household mean income 1-year growth change (%): 2.08%
- Average home value June 2025: $976,830
- One-year home value change (%): 0.57%

9. Pinecrest, Florida
- Suburb of: Miami (6.1 million)
- Household mean income 2023: $312,591
- Household mean income 1-year growth change (%): -0.44%
- Average home value June 2025: $2,386,253
- One-year home value change (%): -1.32%

10. Scottsdale, Arizona
- Suburb of: Phoenix (4.9 million)
- Household mean income 2023: $168,679
- Household mean income 1-year growth change (%): 2.30%
- Average home value June 2025: $946,327
- One-year home value change (%): -0.32%

11. Wellesley, Massachusetts
- Suburb of: Boston (4.9 million)
- Household mean income 2023: $368,179
- Household mean income 1-year growth change (%): -2.94%
- Average home value June 2025: $2,098,597
- One-year home value change (%): 2.72%
Trending Now: I’m an Economist: Here’s How Likely a Recession Is for the Second Half of 2025
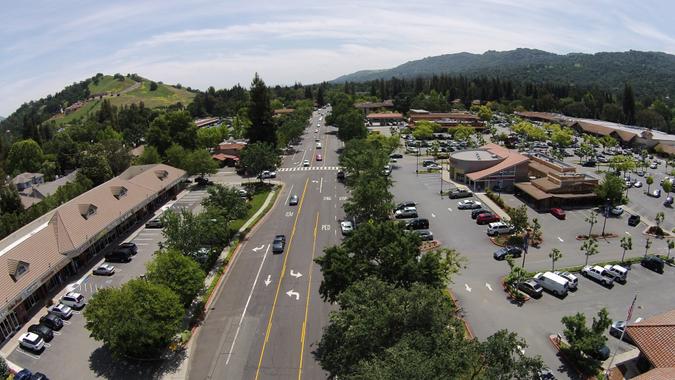
12. Alamo, California
- Suburb of: Oakland (4.7 million)
- Household mean income 2023: $403,334
- Household mean income 1-year growth change (%): 1.32%
- Average home value June 2025: $2,508,177
- One-year home value change (%): -3.27%
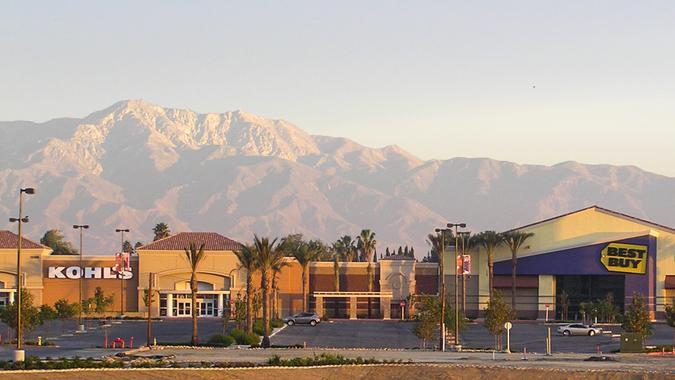
13. Eastvale, California
- Suburb of: Riverside, California (4.6 million)
- Household mean income 2023: $177,404
- Household mean income 1-year growth change (%): 1.93%
- Average home value June 2025: $965,438
- One-year home value change (%): 1.03%
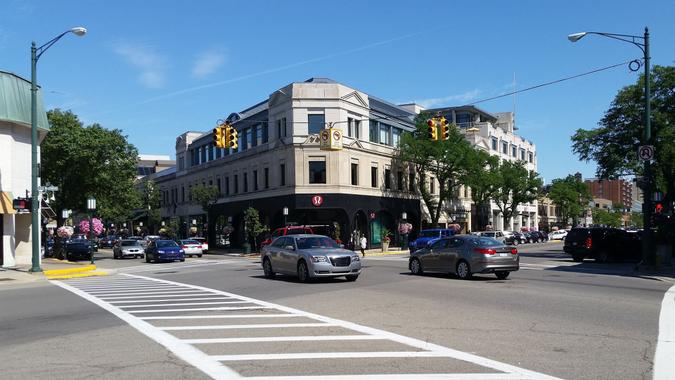
14. Birmingham, Michigan
- Suburb of: Detroit (4.4 million)
- Household mean income 2023: $240,711
- Household mean income 1-year growth change (%): -0.52%
- Average home value June 2025: $822,581
- One-year home value change (%): 4.06%
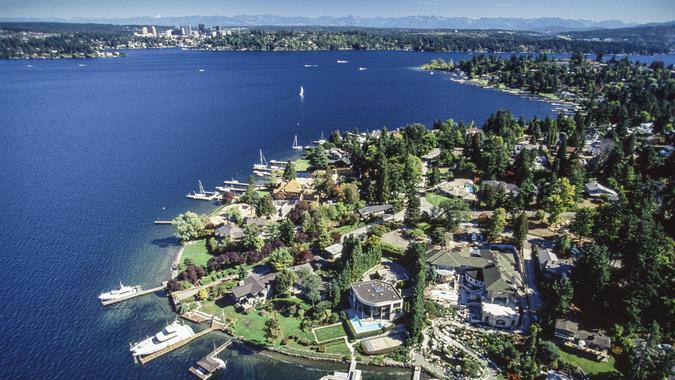
15. Mercer Island, Washington
- Suburb of: Seattle (4 million)
- Household mean income 2023: $303,425
- Household mean income 1-year growth change (%): 1.22%
- Average home value June 2025: $2,494,508
- One-year home value change (%): 2.49%

16. Edina, Minnesota
- Suburb of: Minneapolis (3.7 million)
- Household mean income 2023: $205,682
- Household mean income 1-year growth change (%): 2.30%
- Average home value June 2025: $785,567
- One-year home value change (%): 2.48%
Be Aware: What Is the Estimated Median Income for the Upper-Middle Class in 2025?
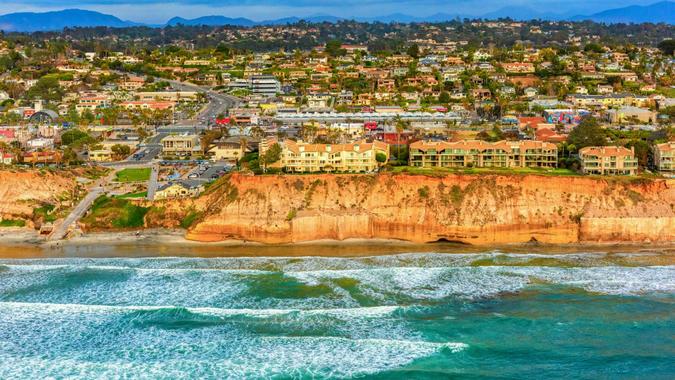
17. Solana Beach, California
- Suburb of: San Diego (3.3 million)
- Household mean income 2023: $216,465
- Household mean income 1-year growth change (%): 2.99%
- Average home value June 2025: $2,561,444
- One-year home value change (%): -0.31%

18. Keystone, Florida
- Suburb of: Tampa (3.2 million)
- Household mean income 2023: $199,755
- Household mean income 1-year growth change (%): 1.19%
- Average home value June 2025: $277,636
- One-year home value change (%): -0.35%

19. Greenwood Village, Colorado
- Suburb of: Denver (3 million)
- Household mean income 2023: $258,780
- Household mean income 1-year growth change (%): -0.20%
- Average home value June 2025: $1,639,158
- One-year home value change (%): 2.75%
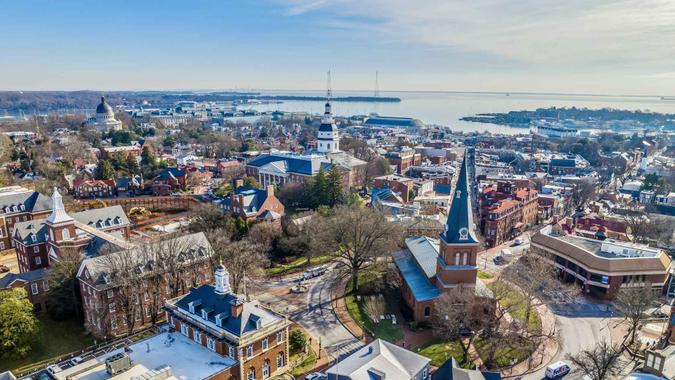
20. Annapolis Neck, Maryland
- Suburb of: Baltimore (2.8 million)
- Household mean income 2023: $240,059
- Household mean income 1-year growth change (%): 7.72%
- Average home value June 2025: $665,302
- One-year home value change (%): 3.22%

21. Clayton, Missouri
- Suburb of: St. Louis (2.8 million)
- Household mean income 2023: $216,884
- Household mean income 1-year growth change (%): 1.51%
- Average home value June 2025: $1,124,202
- One-year home value change (%): 2.26%
View More: Here’s the Minimum Net Worth To Be Considered Upper Class in Your 50s

22. Lake Butler, Florida
- Suburb of: Orlando (2.7 million)
- Household mean income 2023: $289,593
- Household mean income 1-year growth change (%): 3.81%
- Average home value June 2025: $748,699
- One-year home value change (%): -1-78%

23. Davidson, North Carolina
- Suburb of: Charlotte (2.7 million)
- Household mean income 2023: $216,825
- Household mean income 1-year growth change (%): 8.47%
- Average home value June 2025: $710,690
- One-year home value change (%): 1.36%

24. Timberwood Park, Texas
- Suburb of: San Antonio (2.6 million)
- Household mean income 2023: $174,015
- Household mean income 1-year growth change (%): 2.93%
- Average home value June 2025: $529,276
- One-year home value change (%): 0.62%

25. Cedar Mill, Oregon
- Suburb of: Portland (2.5 million)
- Household mean income 2023: $223,012
- Household mean income 1-year growth change (%): -2.04%
- Average home value June 2025: $796,226
- One-year home value change (%): -1.17%
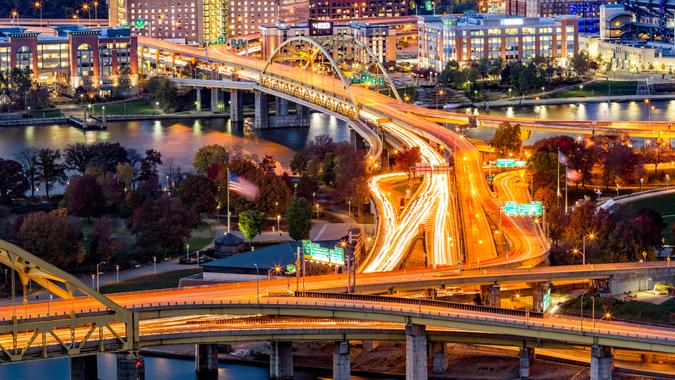
26. Franklin Park, Pennsylvania
- Suburb of: Pittsburgh (2.4 million)
- Household mean income 2023: $218,236
- Household mean income 1-year growth change (%): 3.24%
- Average home value June 2025: $502,695
- One-year home value change (%): 2.25%
Discover Next: What Salary Single People Need To Live Comfortably in 100 Major US Cities
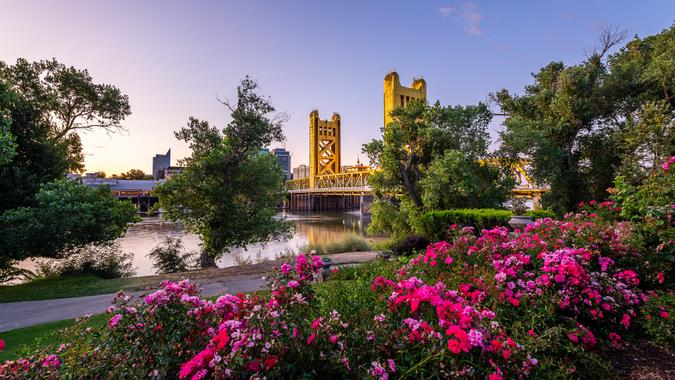
27. Granite Bay, California
- Suburb of: Sacramento (2.4 million)
- Household mean income 2023: $241,994
- Household mean income 1-year growth change (%): 1.19%
- Average home value June 2025: $1,140,609
- One-year home value change (%): 0.70%
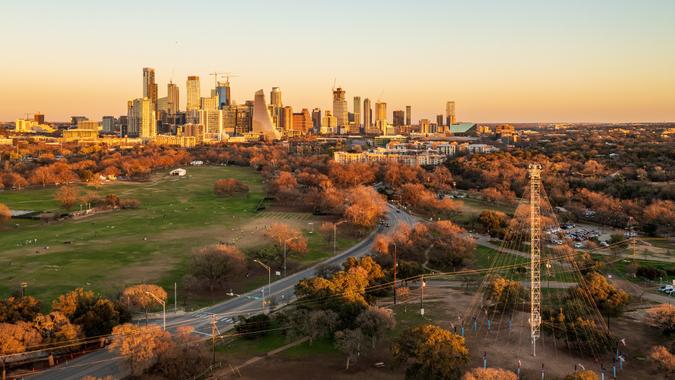
28. Steiner Ranch, Texas
- Suburb of: Austin (2.4 million)
- Household mean income 2023: $232,530
- Household mean income 1-year growth change (%): 4.11%
- Average home value June 2025: $847,186
- One-year home value change (%): -5.97%

29. Summerlin South, Nevada
- Suburb of: Las Vegas (2.3 million)
- Household mean income 2023: $181,232
- Household mean income 1-year growth change (%): 3.05%
- Average home value June 2025: $733,035
- One-year home value change (%): 5.61%

30. Mason, Ohio
- Suburb of: Cincinnati (2.3 million)
- Household mean income 2023: $161,798
- Household mean income 1-year growth change (%): -0.88%
- Average home value June 2025: $565,612
- One-year home value change (%): 4.59%
31. Leawood, Kansas
- Suburb of: Kansas City (2.2 million)
- Household mean income 2023: $257,427
- Household mean income 1-year growth change (%): -0.23%
- Average home value June 2025: $772,459
- One-year home value change (%): 1.19%
Read More: Here’s the Minimum Salary Required To Be Considered Upper-Middle Class in 2025

32. Solon, Ohio
- Suburb of: Cleveland (2.2 million)
- Household mean income 2023: $186,260
- Household mean income 1-year growth change (%): -0.45%
- Average home value June 2025: $461,665
- One-year home value change (%): 4.23%

33. Powell, Ohio
- Suburb of: Columbus (2.2 million)
- Household mean income 2023: $235,043
- Household mean income 1-year growth change (%): 3.95%
- Average home value June 2025: $602,962
- One-year home value change (%): 1.56%

34. Zionsville, Indiana
- Suburb of: Indianapolis (2.1 million)
- Household mean income 2023: $220,563
- Household mean income 1-year growth change (%): 4.73%
- Average home value June 2025: $666,102
- One-year home value change (%): 3.88%

35. Brentwood, Tennessee
- Suburb of: Nashville (2 million)
- Household mean income 2023: $261,248
- Household mean income 1-year growth change (%): 0.57%
- Average home value June 2025: $1,411,965
- One-year home value change (%): 4.31%

36. Los Altos, California
- Suburb of: San Jose (2 million)
- Household mean income 2023: $403,512
- Household mean income 1-year growth change (%): -2.39%
- Average home value June 2025: $4,503,419
- One-year home value change (%): 4.15%
Try This: 9 Things the Middle Class Should Consider Downsizing To Save on Monthly Expenses

37. Suffolk, Virginia
- Suburb of: Norfolk (1.8 million)
- Household mean income 2023: $115,247
- Household mean income 1-year growth change (%): -0.57%
- Average home value June 2025: $379,211
- One-year home value change (%): 2.05%
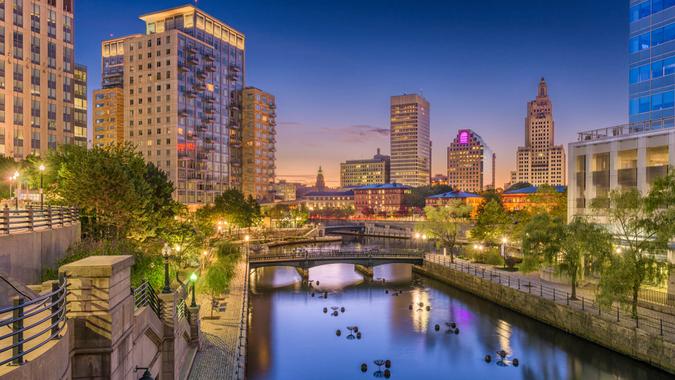
38. Somerset, Massachusetts
- Suburb of: Providence, Rhode Island (1.7 million)
- Household mean income 2023: $135,462
- Household mean income 1-year growth change (%): 3.00%
- Average home value June 2025: $503,165
- One-year home value change (%): 3.91%
39. Nocatee, Florida
- Suburb of: Jacksonville (1.6 million)
- Household mean income 2023: $199,337
- Household mean income 1-year growth change (%): 2.58%
- Average home value June 2025: $256,643
- One-year home value change (%): -4.35%

40. Mequon, Wisconsin
- Suburb of: Milwaukee (1.6 million)
- Household mean income 2023: $209,904
- Household mean income 1-year growth change (%): -1.48%
- Average home value June 2025: $669,603
- One-year home value change (%): -1.27%
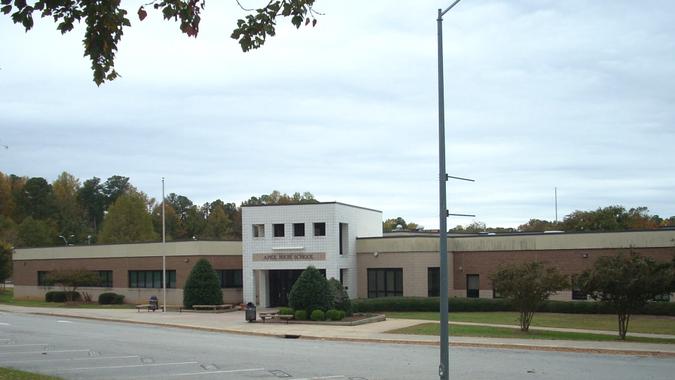
41. Apex, North Carolina
- Suburb of: Raleigh (1.4 million)
- Household mean income 2023: $166,754
- Household mean income 1-year growth change (%): 3.77%
- Average home value June 2025: $621,372
- One-year home value change (%): -0.60%
Read Next: How Much You Need To Earn To Be Upper Middle Class in Every State

42. Edmond, Oklahoma
- Suburb of: Oklahoma City (1.4 million)
- Household mean income 2023: $142,597
- Household mean income 1-year growth change (%): 0.67%
- Average home value June 2025: $353,608
- One-year home value change (%): 0.92%
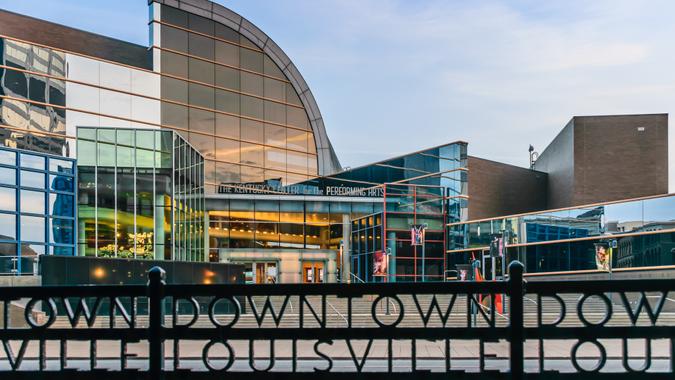
43. Saint Matthews, Kentucky
- Suburb of: Louisville (1.4 million)
- Household mean income 2023: $106,545
- Household mean income 1-year growth change (%): -1.73%
- Average home value June 2025: $423,675
- One-year home value change (%): 3.94%
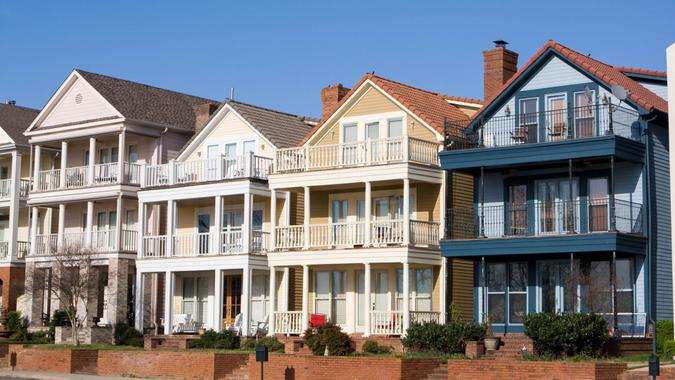
44. Germantown, Tennessee
- Suburb of: Memphis (1.3 million)
- Household mean income 2023: $190,980
- Household mean income 1-year growth change (%): -2.07%
- Average home value June 2025: $498,820
- One-year home value change (%): -1.39%

45. Short Pump, Virginia
- Suburb of: Richmond (1.3 million)
- Household mean income 2023: $170,383
- Household mean income 1-year growth change (%): 1.35%
- Average home value June 2025: $541,502
- One-year home value change (%): 1.64%

46. Draper, Utah
- Suburb of: Salt Lake City (1.3 million)
- Household mean income 2023: $172,277
- Household mean income 1-year growth change (%): 1.27%
- Average home value June 2025: $851,683
- One-year home value change (%): 2.14%
For You: Here’s the Minimum Salary Required To Be Considered Upper Class in 2025

47. Mountain Brook, Alabama
- Suburb of: Birmingham (1.2 million)
- Household mean income 2023: $302,510
- Household mean income 1-year growth change (%): 9.71%
- Average home value June 2025: $1,034,200
- One-year home value change (%): 3.51%
48. Clovis, California
- Suburb of: Fresno (1.2 million)
- Household mean income 2023: $128,557
- Household mean income 1-year growth change (%): 1.16%
- Average home value June 2025: $523,980
- One-year home value change (%): 0.21%
49. Eggertsville, New York
- Suburb of: Buffalo (1.2 million)
- Household mean income 2023: $123,281
- Household mean income 1-year growth change (%): 4.66%
- Average home value June 2025: $313,736
- One-year home value change (%): 3.06%

50. Forest Hills, Michigan
- Suburb of: Grand Rapids (1.2 million)
- Household mean income 2023: $226,614
- Household mean income 1-year growth change (%): -0.02%
- Average home value June 2025: $515,767
- One-year home value change (%): 5.00%
Explore more original studies and surveys in the GOBankingRates original research center.
Editor’s note: Photos are for illustrative purposes only. In many cases, the closest major city outside of the city mentioned in the article was used.
Methodology: For this study, GOBankingRates found the 50 largest metropolitan areas by population as sourced from the U.S. Census 2023 American Community Survey. Using the American Community Survey, the cities with the highest average household income within each MSA were identified. To qualify for this study, the suburb has to have at least 5,000 households and not be a principal city, a city named in the title of the MSA. For each suburb, GOBankingRates identified total population, total households, population ages 65 and over, 2023 household median income, 2023 household mean income and 2022 household mean income — all sourced from the American Community Survey. Using the CPI inflation calculator from the Bureau of Labor Statistics, the 2022 household mean income was used to find the value in 2023. The average single-family home value was sourced from Zillow Home Value Index for each suburb for June 2025 and June 2024. The one-year change in dollar amount and percent was calculated for the inflation-adjusted household mean income and the single-family home value. The suburbs were sorted to show the most population MSA first. All data was collected on and is up to date as of Aug. 1, 2025.
More From GOBankingRates
This article originally appeared on GOBankingRates.com: The Wealthiest Suburb in Each of America’s 50 Largest Metro Areas