
The Fed’s first rate cut of the cycle is here — and as John Rowland, CMT, highlighted during last Friday’s Market on Close livestream, that’s usually bullish fuel for small-cap stocks.
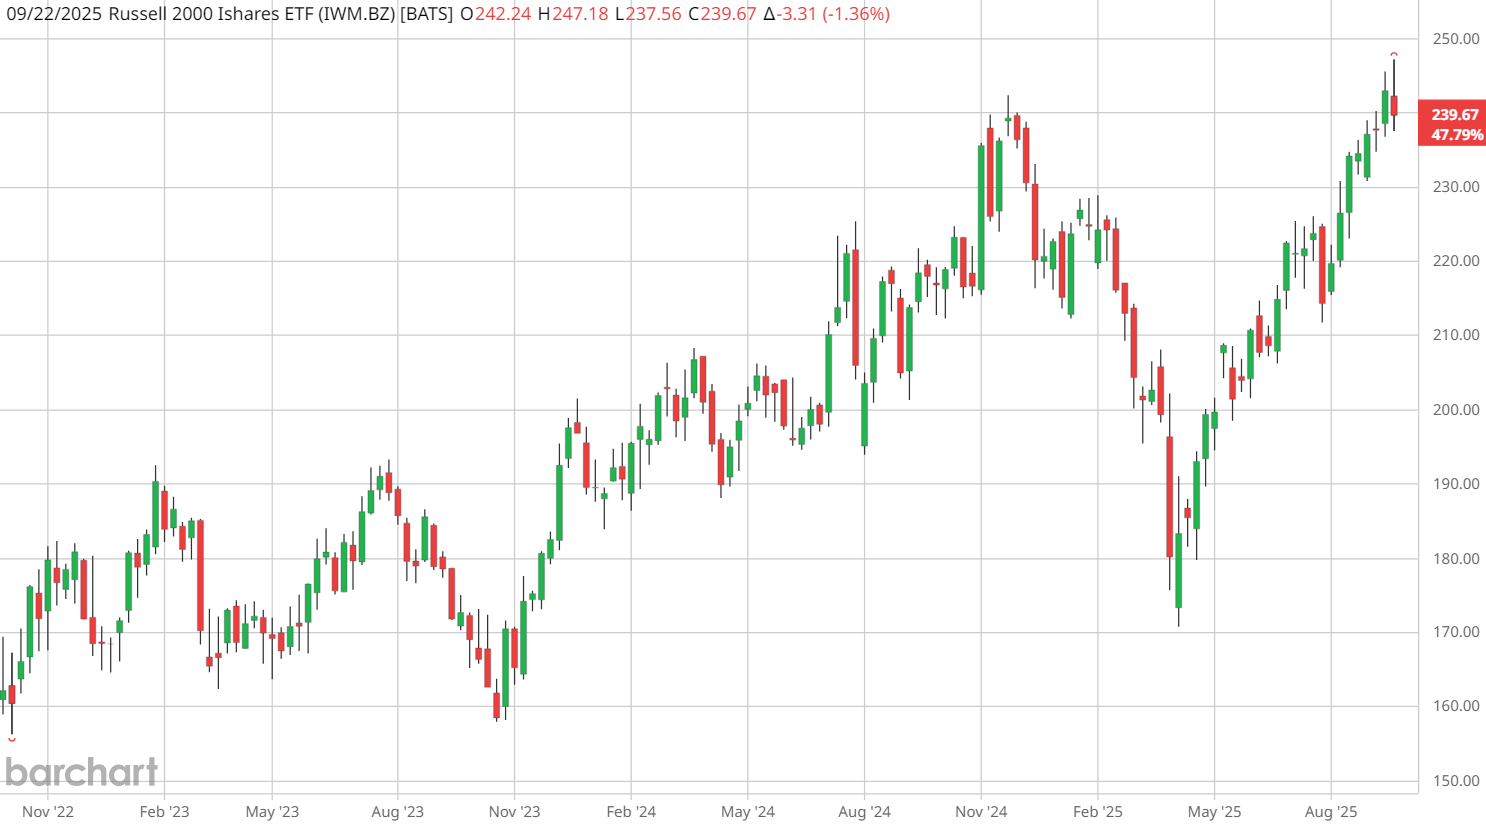
The move is already showing up in price action. The Russell 2000 ETF (IWM) notched a fresh high — its first of the year, and the highest close since 2021.
That’s a three-year breakout.
IWM vs. S&P 600: Same Theme, Different Quality
Not all small-cap ETFs are built the same.
Russell 2000 (IWM):
- ~2,000 companies
- Many are unprofitable or low-quality
- Momentum is strong, but the “junk” factor is real
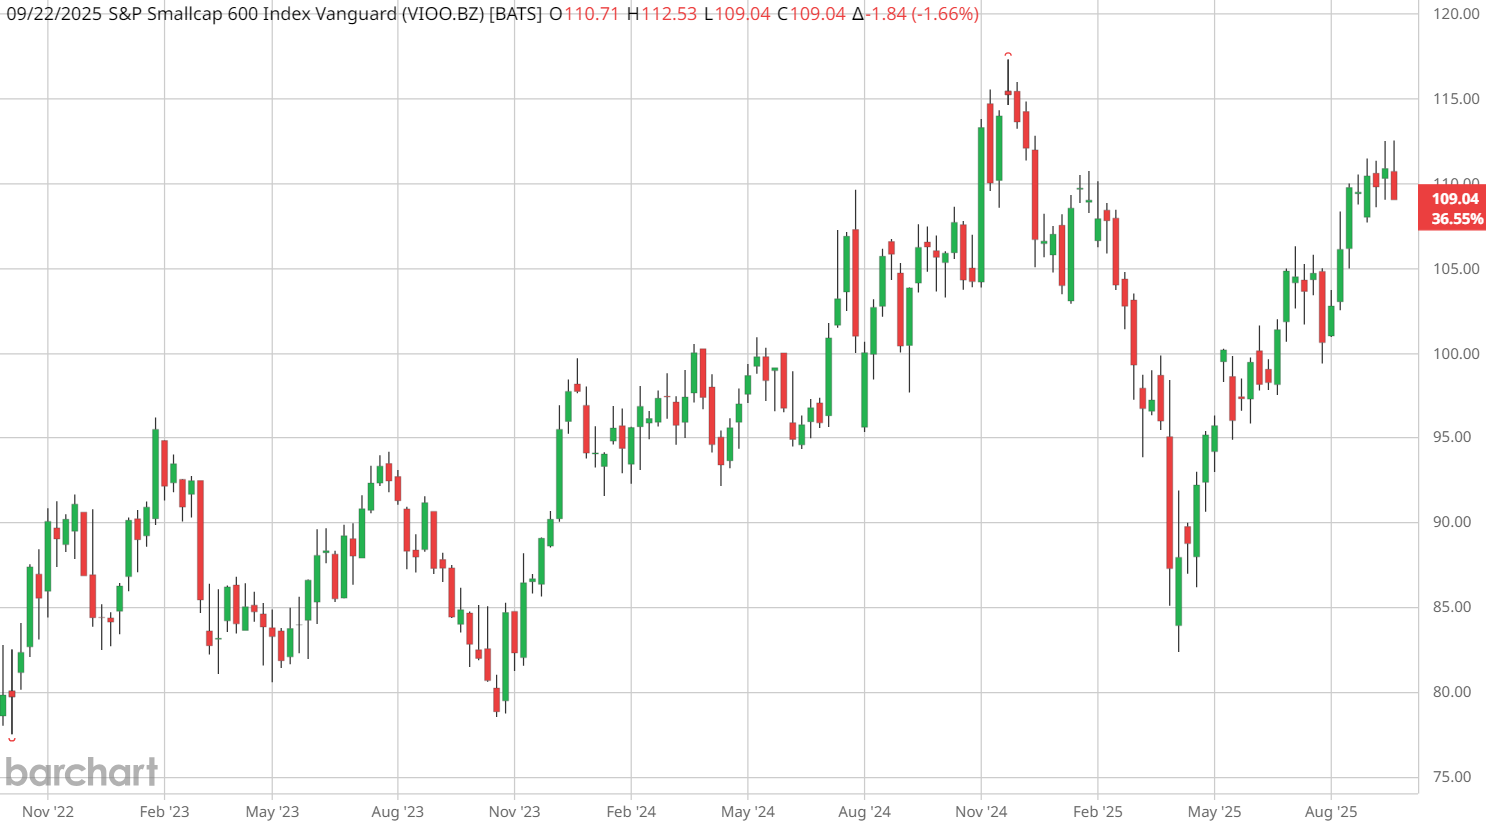
S&P SmallCap 600 (VIOO):
- ~600 companies
- Stringent screening for liquidity and profitability
- You’re essentially getting the “cream of the crop” from the Russell 2000
While IWM has already broken to new highs, the S&P SmallCap 600 ETF is lagging slightly — but showing the same V-bottom formation that could mean upside is coming.
What Traders Should Watch
- Momentum setups: V-bottoms in both IWM and VIOO suggest follow-through.
- Relative strength: Watch if the S&P 600 starts to catch up — that’s a sign quality is leading.
- Macro catalysts: With rate cuts underway, small-caps historically outperform as financial conditions ease.
How to Track the Trade
- Pull up IWM Interactive Chart and overlay RSI/MACD for trend confirmation.
- Compare the IWM & VIOO small-cap ETFs side-by-side.
- Use the ETF Screener to rank small-cap funds by performance, liquidity, and volatility.
- Check the Economic Calendar for upcoming Fed and inflation data that could fuel the next leg of the move.
Bottom Line
Small caps are finally breaking out — but the way you play them matters. IWM offers broad exposure (along with plenty of weak links), while the S&P 600 focuses on profitability and liquidity.
Watch the clip from Market on Close where John Rowland compares the two small-cap funds:
- Stream the full Market on Close episode for more market context on the small-cap rally.
- Explore Barchart’s ETF tools to decide which vehicle fits your strategy.