When the playoffs started, there were some juicy World Series matchups on the table. Each league had two teams with at least 99 wins, so it seemed fairly likely we’d wind up with a battle of powerhouses—or at least one powerhouse and an upstart looking to spin some of that autumn magic that makes Bob Costas swoon.
Instead, none of the four heavyweights won even a single playoff series, and we got ... [waves beer can at TV and shakes head] ... this. Arizona against Texas. A team that won 84 games and made the playoffs just because of the NBA-ification of the postseason against a team that was on a 106-win pace on Aug. 15 and finished 90–72. A Diamondbacks franchise whose high point came when they beat the Yankees in the World Series at the one and only point in history when everyone wanted New York to win versus a Rangers franchise whose high point—coming within one win of a title in 2011—also qualifies as its biggest heartbreak.
As the League Championship Series wound down and Rob Manfred’s waking nightmare became more and more inevitable, I sent a text to a thread of baseball obsessives pointing out that the organizations were so lacking in historical star power that by Game 5 we’d be watching Billy Sample throw out the first pitch. One of the other guys responded that it would be more fitting if Bobby Witt Sr., who pitched for both franchises, was tapped to throw out a ceremonial wild pitch. Touché.
So no, this matchup doesn’t fare well in the sniff test, but scientifically speaking, just how bad is it? And are we necessarily doomed to a bad series?
To get to the bottom of those issues, I did some math. I downloaded relevant data from every World Series team in history (massive hat tip to Baseball Reference and its Stathead feature), put the numbers into a spreadsheet and started fiddling with formulas. I settled on four categories.
• Total WAR: Simply the combined wins above replacement for both rosters, which should give some idea of how good the players themselves were. (Since WAR is a counting stat, I normalized all the numbers to a 162-game schedule.)
• OPS+ and ERA+: This seems as simple yet effective measure as any at judging the relative strength of both teams. Nothing fancy: I just added up both teams’ pluses.
• Winning percentage: Pretty self-explanatory. How well did the teams do at, you know, the one thing they’re supposed to do: win? Just went with the combined percentage here.
• Pythagorean winning percentage: a way to account for good and bad luck. Like winning percentage, I just used a combination of the two teams’ numbers.
Then I ranked every Fall Classic matchup from 1 to 120 in each of those four categories and added the rankings together. (It’s 120 because I decided to include the pennant winners from 1904, when there was no World Series. Turns out turn-of-the-century fans missed what would have been a historically better-than-decent contest.) Since WAR is more of a measure of the players and the other three are team-oriented, I weighted things so the WAR ranking was 50% of the total, and the remaining three categories combined to make up the other half.
Enough with the math. Let’s see the results.
Watch MLB with Fubo. Start your free trial today.
Greg Nelson/Sports Illustrated
TOP FIVE
1. 2020: Dodgers over Rays
WAR: 125.0 (1st)
Pluses: 492 (1st)
Win%: .692 (1st)
Pythag: .662 (7th)
Immediately we get into a small-sample situation. Over the course of a shortened 60-game season, Tampa Bay went 40–20, which translates to 108 wins over a full season. That’s a number the Dodgers must have looked at and said, “Aw, how cute. We’re on pace for 116–46.”
Still, 60 games is more than a third of the season. It’s not nothing. Los Angeles was loaded, with Mookie Betts leading a group of six regulars who slugged at least .450 and a resurgent Clayton Kershaw anchoring a staff that had an ERA+ of 146. And the Rays were the Rays: A bunch of useful Ben Zobrist types who did a lot of things well and got on base a lot, plus a pitching staff made up of hard-to-solve guys who never threw more than five innings at a time.
Did it live up to expectations? Pretty much. It was a fairly close series that featured a wild error-assisted walk-off Tampa win and a Dodgers comeback in the clinching sixth game that was aided by a controversial decision by Rays manager Kevin Cash to yank Blake Snell for no good reason. All in all, quality baseball. Not the best series ever, but pretty good.
2. 1927 Yankees over Pirates
WAR: 119.8 (2nd)
Pluses: 463 (5th)
Win%: .662 (12th)
Pythag: .655 (9th)
Perhaps the most famous Yankees squad of all time propped up the overall score here. New York had the highest total WAR of any team in history (72.9), thanks to Babe Ruth, who hit 60 homers. Or five more than the Pirates hit as a team. Lou Gehrig drove in 173 runs and hit .373. And let’s not overlook how good the pitching staff was. They led the AL with a 3.20 ERA.
The Pirates, meanwhile, had the Waner brothers—Big Poison and Little Poison—and Pie Traynor, all of whom hit better than .340.
Did it live up to expectations? Look, I’m old, but I’m not that old. I can’t tell you how the zeitgeist ran 96 years ago. But when I picture a group of men in bowler hats crowded around a transistor radio outside a Woolworth’s in the downtown of every major American city, I don’t imagine them saying, “I say, I’m hoping for a bully series! Truly top notch!” No, it’s more, “Well, I wonder what sort of walloping the New York batsmen will inflict upon the Pittsburghers.”
If the latter was the case, the people got what they wanted. Sometimes you’re not looking for a close game. You want to see a beatdown. The Yankees were Murderers’ Row. It was pretty clear the Pirates were the Murderees. New York swept in a series that ended with a walk-off wild pitch.
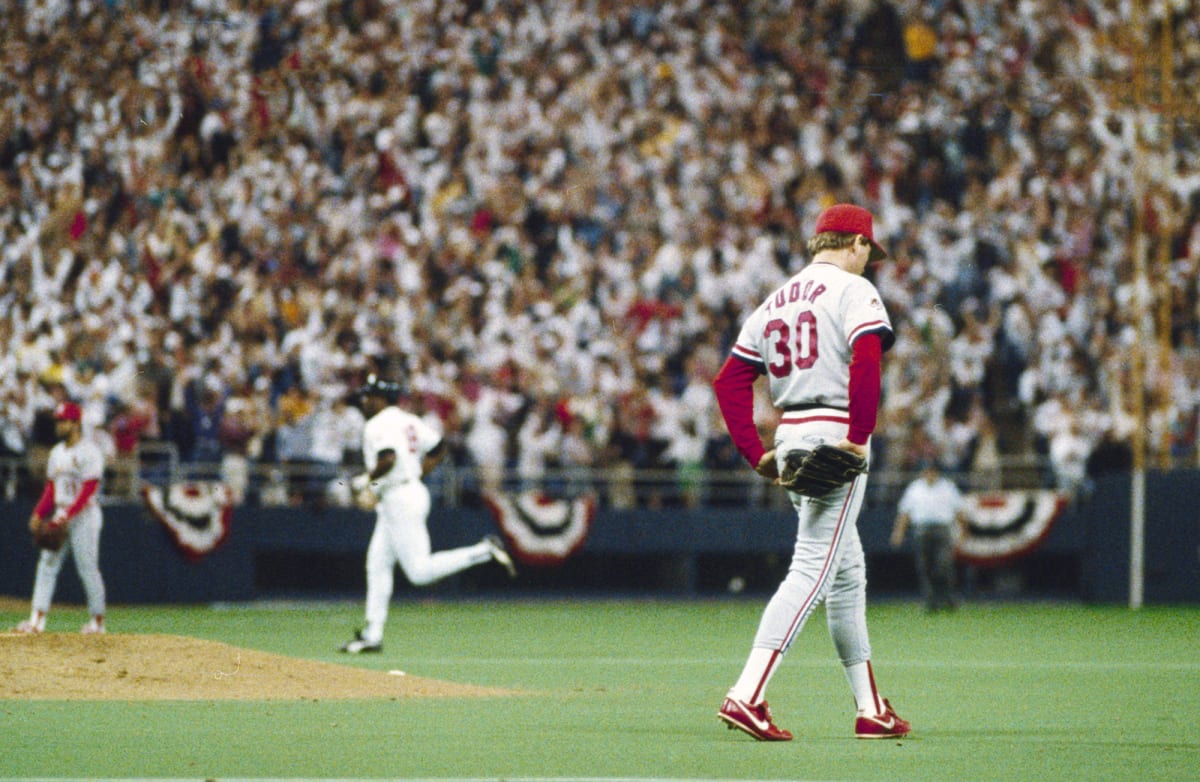
3. 1939: Yankees over Reds
WAR: 114.4 (4th)
Pluses: 461 (7th)
Win%: .666 (11th)
Pythag: .679 (3rd)
I admit, I knew next to nothing about the 1939 Yankees until I started this little exercise. But, man, they were good. They were 106-45-1, but their Pythag was even better. They outscored their opponents by more than 400 runs! They should have been 111–40. They had Joe DiMaggio leading the way on offense, and a league-best pitching staff that featured guys named Red, Lefty, Bump, Monte and Spud. They were delightful!
The Reds were a good team with a pair of 25-game winners, only one of whom had an especially fun name (Bucky). At the end of the day, they were cannon fodder, and they knew it.
Did it live up to expectations? The Yankees clinched it by scoring two ninth-inning runs and then adding a three-spot in the 10th. But that was Game 4—the series was a foregone conclusion by then.
4. 1912: Red Sox over Giants
WAR: 109.1 (10th)
Pluses: 465 (4th)
Win%: .687 (3rd)
Pythag: .665 (5th)
O.K., two really good teams filled with old-timey Hall of Famers. Let’s get on to the good part ...
Did it live up to expectations? Oh my god, did it ever. First, it was a best-of-seven series that went eight games, because Game 2 was called on account of darkness. (Come on, Edison! And no, it was not Bud Selig’s decision.) Every contest was tight until the Red Sox got blown out in Game 7 at home, setting up a decisive eighth game, whose location was determined by a coin toss. Boston won, but its largest group of fans, the Royal Rooters, boycotted the game because they had a beef over their regular seats being sold for Game 7. (So next time you hear a Red Sox fan tell you how the city has always lived and died with their team, throw that fact in their face. Then duck.)
Game 8 was tied at 1-all after nine. Smoky Joe Wood, who had been run in the first inning the day before, had come on to pitch for Boston in the eighth and gave up a run in the top of the 10th. In the bottom half, New York’s Fred Snodgrass dropped a routine fly ball, triggering a rally that culminated with Boston scoring the winning run on a sac fly. In a half-empty stadium. Red Sox Nation! Whatever.
5. 1954 Giants over Cleveland
WAR: 112.2 (6th)
Pluses: 462 (6th)
Win%: .676 (8th)
Pythag: .650 (14th)
This should have been great. Cleveland rode an amazing pitching staff and a stout offense to an AL-record 111 wins, while New York had a young Willie Mays, who, at age 23, merely hit 41 homers and slashed .345/.411/.667 while putting up a 2.0 dWAR in center field.
Did it live up to expectations? For one game, yes. Mays made the greatest catch in baseball history in Game 1, saving two runs in a tie game with an amazing grab on a ball that Vic Wertz hit approximately 900 feet into the cavernous Polo Grounds outfield. That was the gut punch. And while Cleveland was doubled over trying to recover, Dusty Rhodes (not the wrestler, though it might as well have been) came in and dropped an elbow to the back of the team’s collective head with a three-run bomb in the bottom of the 10th. After that, it was all Giants.
MIDDLE OF THE PACK
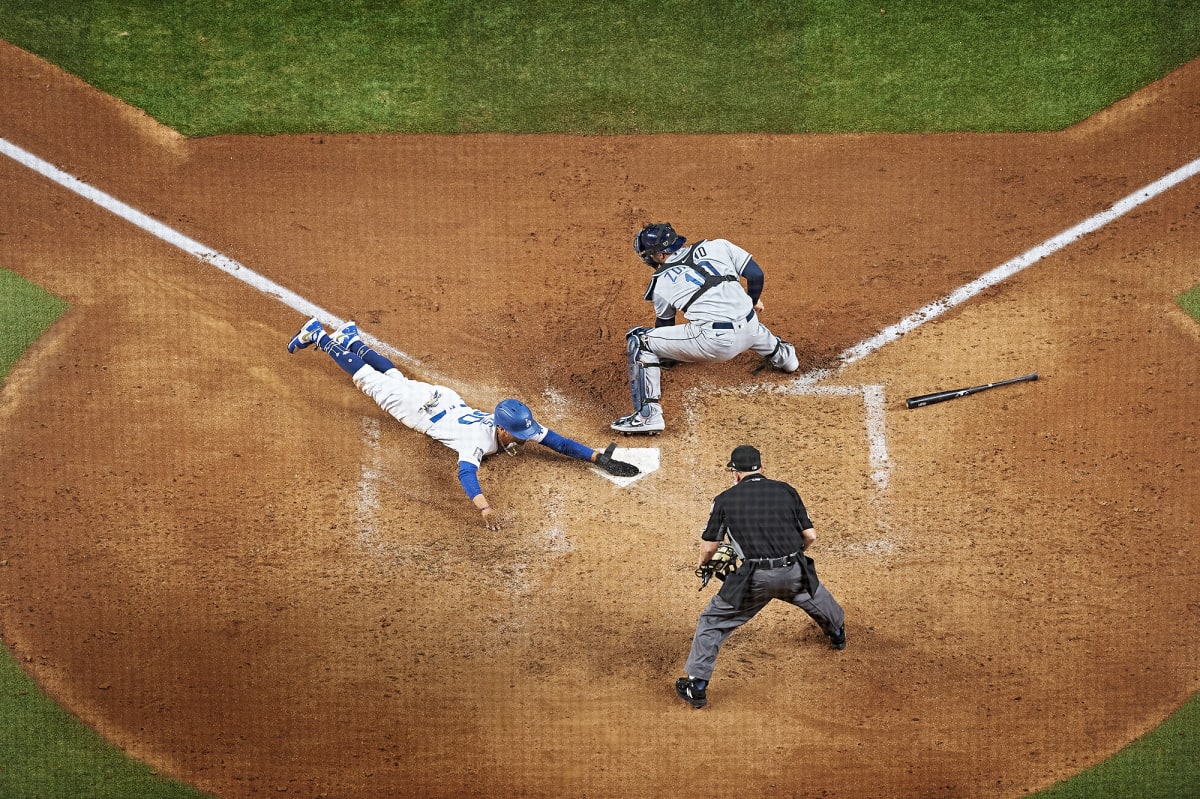
Three quick mentions: The 1904 World Series between the A’s and the Giants, which never happened, would have been 13th. The ’91 Series between Minnesota and Atlanta, arguably the best ever played, finished 80th. And this year’s Diamondbacks-Rangers affair checks in at 113th, just ahead of this ...
BOTTOM FIVE
116. 1973: A’s over Mets
WAR: 80.8 (114th)
Pluses: 411 (115th)
Win%: .545 (119th)
Pythag: .558 (111th)
You know how people lament how sad it was to see Willie Mays doddering around Shea Stadium at the end of his career? Well, in 1973, his last season, he had an OPS+ of 81 on a team whose OPS+ was 83. So—not so bad after all, Willie! The Mets’ obscenely terrible offense was offset by a loaded pitching staff (led by Tom Seaver, Jerry Koosman and Jon Matlack) that limited the nascent Big Red Machine to eight runs in a five-game NLCS win. Sure, Oakland was in Year 1 of its minidynasty and had Reggie Jackson, Catfish Hunter, Rollie Fingers and Vida Blue. But New York’s 83-win season and abject lack of offense drags this series into the nether regions of our list.
Did it live down to expectations? No. It somehow went seven games, and it ended with the potential tying run at the plate for the Mets. That potential tying run was Wayne Garrett, who hit .132 in the series and popped out to the shortstop, but still ...
John Biever/Sports Illustrated
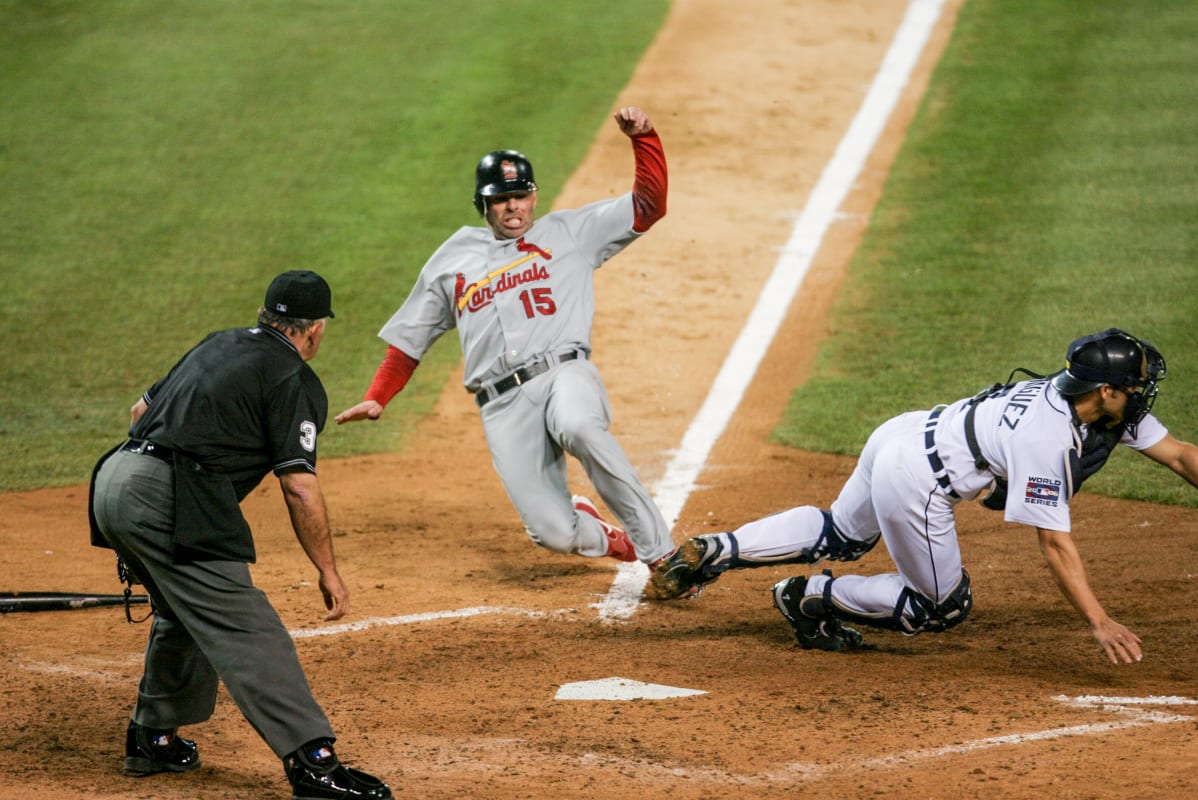
117. 2006: Cardinals over Tigers
WAR: 77.9 (118th)
Pluses: 412 (114th)
Win%: .551 (116th)
Pythag: .550 (113th)
Detroit was a fine team, winning 95 games with a pitching staff that included Justin Verlander and an effective 41-year-old Kenny Rogers, supported by a lineup that had five guys who hit at least 19 homers (which was pretty good in 2006). St. Louis was a dumpster fire that won 83 games and got into the playoffs despite squandering 6½ games of a seven-game lead in a week and a half in late September.
Did it live down to expectations? More or less. The Cardinals pulled off the upset, but it was in a five-game yawner. David Eckstein won the MVP, setting the whole Scrappy Train in motion.
118. 2000: Yankees over Mets
WAR: 78.1 (117th)
Pluses: 410 (116th)
Win%: .560 (114th)
Pythag: .536 (118th)
This is an interesting one. I wouldn’t have expected a mid-dynasty Yankees team to be in a series ranked this low. While the Bombers had their share of big names, many of them had off years. Consider: The hitter with the fourth-highest OPS was Glenallen Hill, who played 40 games. (They were the only 40 he’d play in pinstripes; file that away for the next time you get a Yankees x Giants square in Immaculate Grid.) As for the Mets, they were a perfectly cromulent 94-win team.
Did it live down to expectations? Hard to say, but probably. I was living in New York at the time and am a fan of neither team, so I was in hype central and wishing for some sort of mutual destruction. I’m guessing outside of New York no one was too excited about a five-game affair whose most memorable play was a foul ball that led to Roger Clemens spiking a shard of wood he later claimed he thought was a baseball. If nothing else, the matchup was proof that Subway Series aren’t as exciting as they’re made out to be.
119. 2014: Giants over Royals
WAR: 74.9 (119th)
Pluses: 404 (118th)
Win%: .546 (118th)
Pythag: .528 (119th)
A pair of sub-90 win teams, neither of whom won their division. The Royals were lucky to get out of the wild-card round—which back then was still one game—when they overcame a 7–3 deficit in the eighth against the A’s and then had to score twice in the bottom of the 12th to win. The Giants had one of the thinnest rotations in the league—except for the workhorse at the front of it, Madison Bumgarner.
Did it live down to expectations? Yes and no. Of the first six games, five were blowouts. But in Game 7, San Francisco’s Tim Hudson got an early hook, which led to Bumgarner, who had thrown a four-hit shutout three days earlier, coming in to pitch the last five innings. He gave up two hits and kept K.C. off the board, preserving a 3–2 win and wrapping up Sports Illustrated’s Sportsperson of the Year.
Heinz Kluetmeier/Sports Illustrated
120. 1987: Twins over Cardinals
WAR: 70.5 (120th)
Pluses: 391 (120th)
Win%: .556 (115th)
Pythag: .522 (120th)
What a bizarre juxtaposition of styles. The Twins played in a bandbox and did nothing but hit home runs (they were 10th in the league in batting average but third in slugging percentage). They had two good pitchers—Frank Viola and Bert Blyleven—and nothing else. (Those two started nine of the Twins’ 12 postseason games. I’ll give you five bucks if you can name the guy who started the other three*.) Minnesota is the rare team that made the World Series with a negative run differential: Its expected won-loss record was 79–83.
*Not a binding offer.
As for the Cards, they were the ultimate Astroturf cookie-cutter squad. Zero power, tons of speed. The lone exception was Jack Clark, who had an OPS+ of 176, which is amazing. The next best: Bob Forsch (118), a starting pitcher who hit two homers in 71 plate appearances. Compare that with the following regulars: Tony Peña (five homers in 425 PAs). Tom Herr (two in 598). Ozzie Smith (zero in 706). Vince Coleman (three in 702). You get the picture. This was a team with no pop, but they tried to make up for it by running circles around opponents. St. Louis stole 248 bases. Cards runners were caught stealing 78 times, which is the kind of thing that would make any 2023 front-office type’s head explode. This matchup ranked dead last in three of our four categories.
Did it live down to expectations? Reader, it did not! This was one of the most memorable World Series of my lifetime. It gave us the Homer Hanky, for crying out loud. It was exactly what it was supposed to be: The home team won every time. Which meant the Twins jumped out to a 2–0 lead and looked like they had things under control, then the Cardinals came back with three in a row to put themselves on the brink, then Minnesota poured on a lot of late-inning misery in Games 6 and 7 to win the title. The atmosphere was positively electric. I didn’t even like the team, but I got so caught up in things that I bought a Twins T-shirt.
(Oh, the other Minnesota starter? Les Straker. Made his debut in 1987. Made his last appearance in ’88.)
If nothing else, the 1987 World Series was a reminder that you can’t judge a matchup by how the teams have played up to that point. Even the most dour teams can provide some magic. So there’s hope for us all.