
Apple
Other components of the S&P 500 and the Dow Jones Industrials peaked months ago and now have a bear market look — although they don’t get the media attention of the big name big techs.
Take a look at the percentage of stocks in the S&P now trading above their 50-day moving averages:
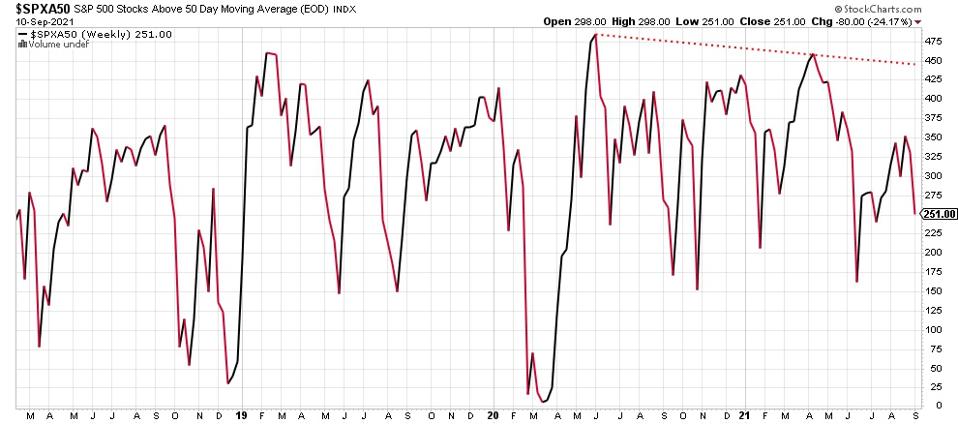
Fewer and fewer is the point. The steady parade of new all time highs in the indices is being propped up by just a few big name favorites while other stocks steadily tank.
For a closer, more revealing kind of analysis, here’s a price chart look at the 3 worst performing members of the Dow. If you’ve been focused on the strength among technology and social media, you may have missed the recent definite selling in other stocks such as...
Boeing
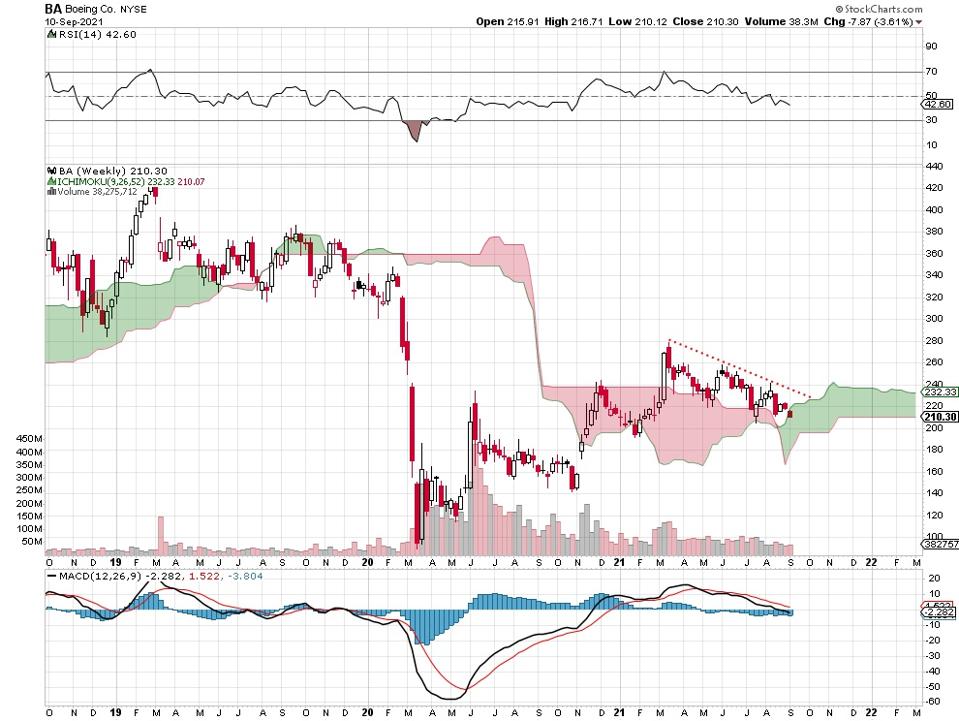
The stock never made it back to the 2019 all time high up there above 420. Even the big buying blast for the markets coming off of the March, 2020 pandemic low couldn’t do it. Now, Boeing is unable to rise above this year’s March high of 280. This action is quite different than that of the most talked about Dow components.
Kraft Heinz
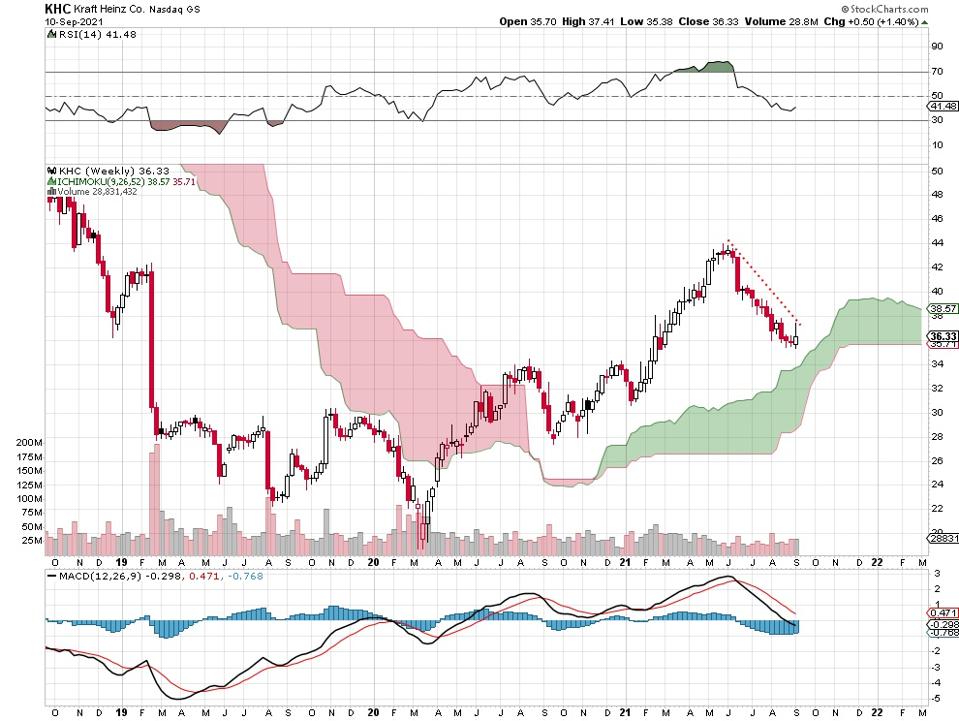
It’s one of the top 5 components of Berkshire Hathaway’s
Verizon
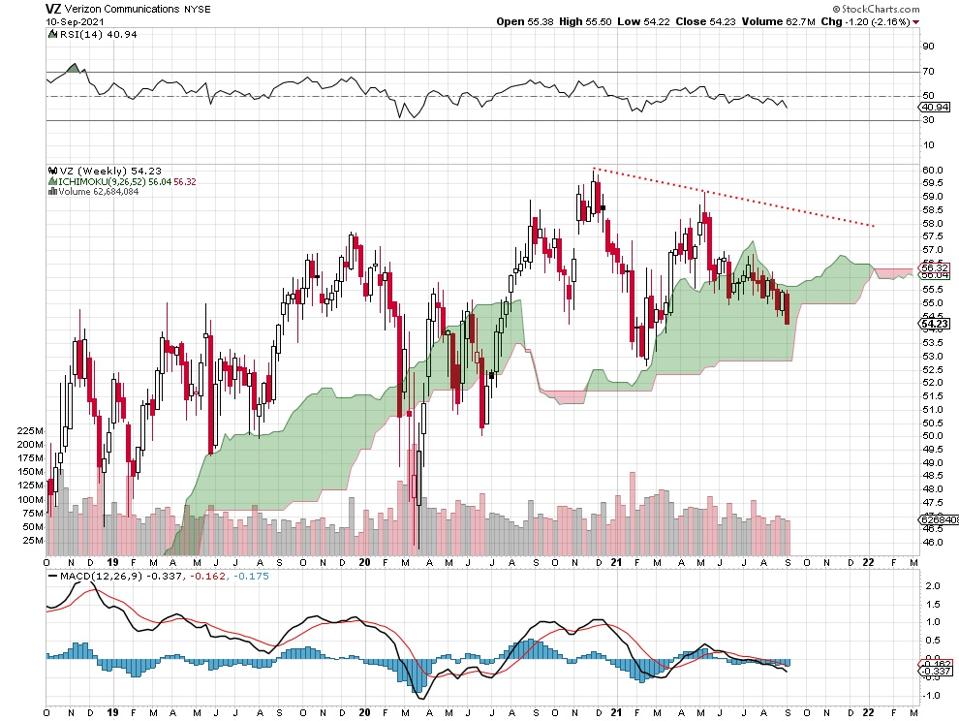
You can see the powerful move from the March, 2020 low of 46 to the November, 2020 high of about 60. It’s been unable to move higher than that since then. Verizon is another well-known Dow component that’s steadily declined during this summer while Apple and Microsoft kept grabbing the attention with the “all time highs” headlines.
The negative divergence between most of the market and the popular-with-the-media big tech names is a non-confirmation of the “new all-time highs” narrative. To be sure, massive buy programs could return and stocks in general could continue upward. You have to wonder how long this kind of narrowing into a handful of hot stocks can remain intact as so many other sectors keep cooling off.
Not investment advice. Do your own research and always consult with a registered investment advisor before making any decisions.