A bearish key reversal on the daily chart occurs when the price rises to a higher high than the previous session and settled below the prior session’s low. On December 4, February COMEX gold futures put in a bearish key reversal pattern on the daily chart, and March COMEX silver futures followed like an obedient puppy.
In a September 9 Barchart article, I suggested that trading the range in silver was the optimal approach. In that piece, I wrote:
I am long silver, as I hold a physical position. I believe silver will eventually surprise on the upside. However, the choppy trading environment has made trading a better strategy than just holding the metal. I maintain my core position but will continue to buy dips, adding to the length, and sell on rallies to reduce the exposure.
March silver futures rose to $26.34 per ounce on December 4, when they ran out of upside steam. On December 12, the price was at the $23 level after a bearish reversal killed the December 4 rally and led to another correction. The iShares Silver Trust (SLV) is a liquid ETF that moves higher and lower with silver futures prices.
A pair of bearish reversals
On December 4, 2023, gold reached a new record high.

The February 2024 COMEX gold futures chart shows the rise to $2,152.30 and a reversal that caused gold to close below the previous session’s low. The bearish key reversal sent gold prices lower over the following sessions to a challenge of the $2,000 level.
While silver did not come anywhere near an all-time high, the price action followed gold on December 4.

COMEX March silver futures rose to $26.34 per ounce on December 4 but settled below $25, under the prior session’s low, putting in a bearish key reversal pattern on the daily chart.
The pair of bearish key reversals led to lower prices.
Range trading in 2023 offered opportunities
Nearby continuous contract silver futures trading ranges over the past years were:
- 2020- $11.735 to $29.53 = $17.795
- 2021- $21.459 to $30.16= $8.701
- 2022- $17.32 to $27.32= $10.00
- 2023- $19.83 to $26.20= $6.37
In 2023, with only a few weeks to go, silver traded in the tightest range since 2019, when the differential between the high and low was $5.295 per ounce. 2023 has been a consolidation period for the silver market, with prices mainly remaining above the $20 per ounce level.

The monthly chart shows buying dips and selling rallies was the optimal approach as the price fell just below $20 in March 2023 before rallying to over $26 in May. Another decline took silver below $21 in October before the latest rally above the $25 level. The narrowing range indicates price consolidation, eventually leading to a break to the up or downside.
Silver is consolidating while gold makes higher highs
Gold and silver tend to move in the same direction, but silver has lagged behind gold over the past years. Gold’s bull market began in 1999, and while the precious yellow metal did not move higher in a straight line, every correction has been a buying opportunity. Gold rose to new record highs in 2008, 2009, 2010, 2011, 2020, 2021, 2022, and 2023. Meanwhile, silver has remained below its 1980 record $50.36 peak. In 2011, the price stopped short of a challenge of the 1980 peak when it reached $49.52 per ounce.
The silver-gold ratio measures the value of silver compared to gold. Since the 1970s, it has traded from a low of 15.472 ounces of silver value in each ounce of gold value to 139.633 ounces of silver in each ounce of gold.

The chart ({GCG24}/{SIH24}) highlights at just below 87:1, silver is above the average of the past half-century. Silver has lagged behind gold’s ascent. At $2,000 per ounce on December 12, gold was nearly eight times the price at the 1999 low. Silver at $23 per ounce on December 12 was 5.7 times higher than its 2001 $4.026 low.
The reasons 2024 could be a silver bonanza
The following factors could lead silver higher in 2024 as the precious metal is overdue for an explosive move:
- Consolidation tends to lead to a technical breakout. Gold and silver have been in bull markets for over two decades, so the long-term trends favor the upside.
- Stable to lower interest rates in 2024 would support higher gold and silver prices.
- Geopolitical events creating uncertainty are bullish for gold and silver, the world’s oldest means of exchange.
- Industrial demand for silver continues to increase. According to the Silver Institute, “Industrial demand is expected to grow 8% to a record 632 million ounces this year. Key drivers behind this performance include investment in photovoltaics, power grid and 5G networks, growth in consumer electronics, and rising vehicle output.”
- A continuation of higher highs in gold prices should increase silver’s investment demand, which is the critical factor for the path of least resistance of prices.
- Technical resistance for silver is just above the $30 per ounce level, the early 2021 high. A break over the level would likely cause a herd of trend-following, speculative, and investment buying.
- Monthly historical gold volatility was at the 14.4% level on December 13, with the metric in silver at the 29.43% level. Silver’s price variance is over double gold’s, meaning the metal will likely magnify gold’s price action on a percentage basis.
Based on the 1980 and 2011 highs, silver could have lots of room to rally over the coming year.
SLV is the silver ETF product
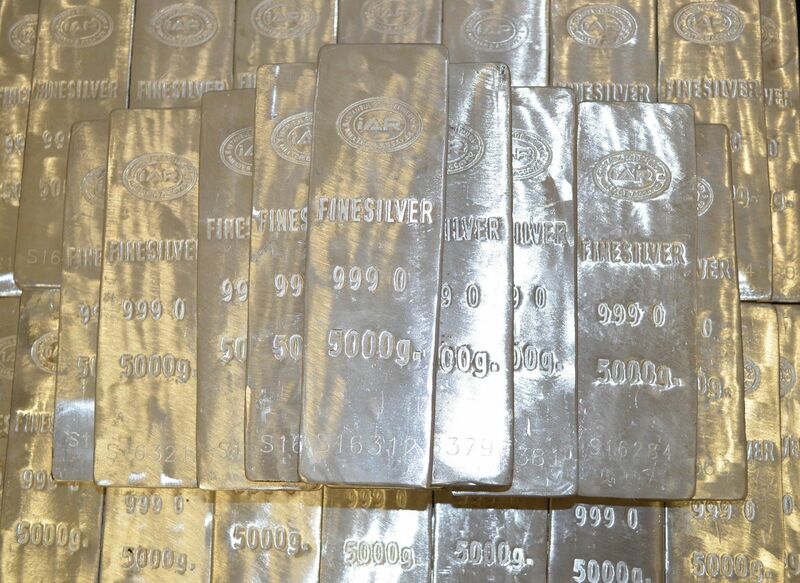
The most direct route for a risk position in silver is via the physical market for bars and coins. Silver is a bulky metal; a 1,000-ounce bar worth $23,000 weighs 71 pounds. A 100-ounce gold bar worth $200,000 weighs 7.1 pounds. Therefore, silver investors tend to flock to futures or derivative products. Each COMEX silver futures contract contains 5,000 ounces of silver, worth $115,000 at $23 per ounce. Initial and maintenance margin levels at $8,800/$8,000 per contract create significant leverage as the original market is under 8% of the contract value.
Meanwhile, the iShares Silver Trust (SLV) moves higher and lower with silver prices. SLV’s fund summary states:

At $20.82 per share on December 12, the highly liquid ETF had nearly $9.95 billion in assets under management. SLV trades an average of over 17.8 million shares daily and charges a 0.50% management fee.
The most recent rally in March silver futures took the price 24.4% higher from $21.17 on October 4 to $26.34 on December 4.

Over the same period, SLV appreciated 23.2% from $18.97 to $23.37 per share. A drawback of SLV is it only trades during U.S. stock market hours, while silver trades around the clock. The ETF could miss highs or lows when the stock market is not operating. SLV missed silver’s December 4 high because it occurred before the U.S. stock market opened.
The December 4 bearish key reversal patterns in gold and silver led to lower prices. However, the selloff could be another compelling buying opportunity for 2024 as the bull market in gold continues, and higher gold prices will likely cause silver to go along for the bullish ride.
On the date of publication, Andrew Hecht did not have (either directly or indirectly) positions in any of the securities mentioned in this article. All information and data in this article is solely for informational purposes. For more information please view the Barchart Disclosure Policy here.