The oil and gas industry’s juggernaut, Exxon Mobil Corporation (XOM), is trying to drive its operations toward greater sustainability. Although the company expects oil and gas to meet more than 50% of the world’s energy needs, it is investing $17 billion over a six-year span through 2027 in lower carbon emissions technologies.
For instance, XOM agreed to buy Denbury Inc. (DEN) for $4.9 billion to accelerate its energy transition business with a ready-made carbon dioxide (CO2) sequestration operation. However, the broad adoption of carbon sequestration is still uncertain because of technical challenges and high costs.
The company and its partners also revealed planned spending of $12.93 billion to develop their sixth offshore oil project in Guyana. The project does not include natural gas because any reduction in injected gas would potentially reduce oil recovery.
XOM sees China as a long-term growth market for Liquefied Natural Gas (LNG). While the company looks for potential downstream opportunities in China, its economic landscape continues to weigh on its LNG demand.
Given this backdrop, let’s look at the trends of XOM’s key financial metrics to understand why it could be wise to watch and wait for a better entry point in the stock.
Analyzing Exxon Mobil Corporation's Financial Landscape: Trends and Shifts (2020 - 2023)
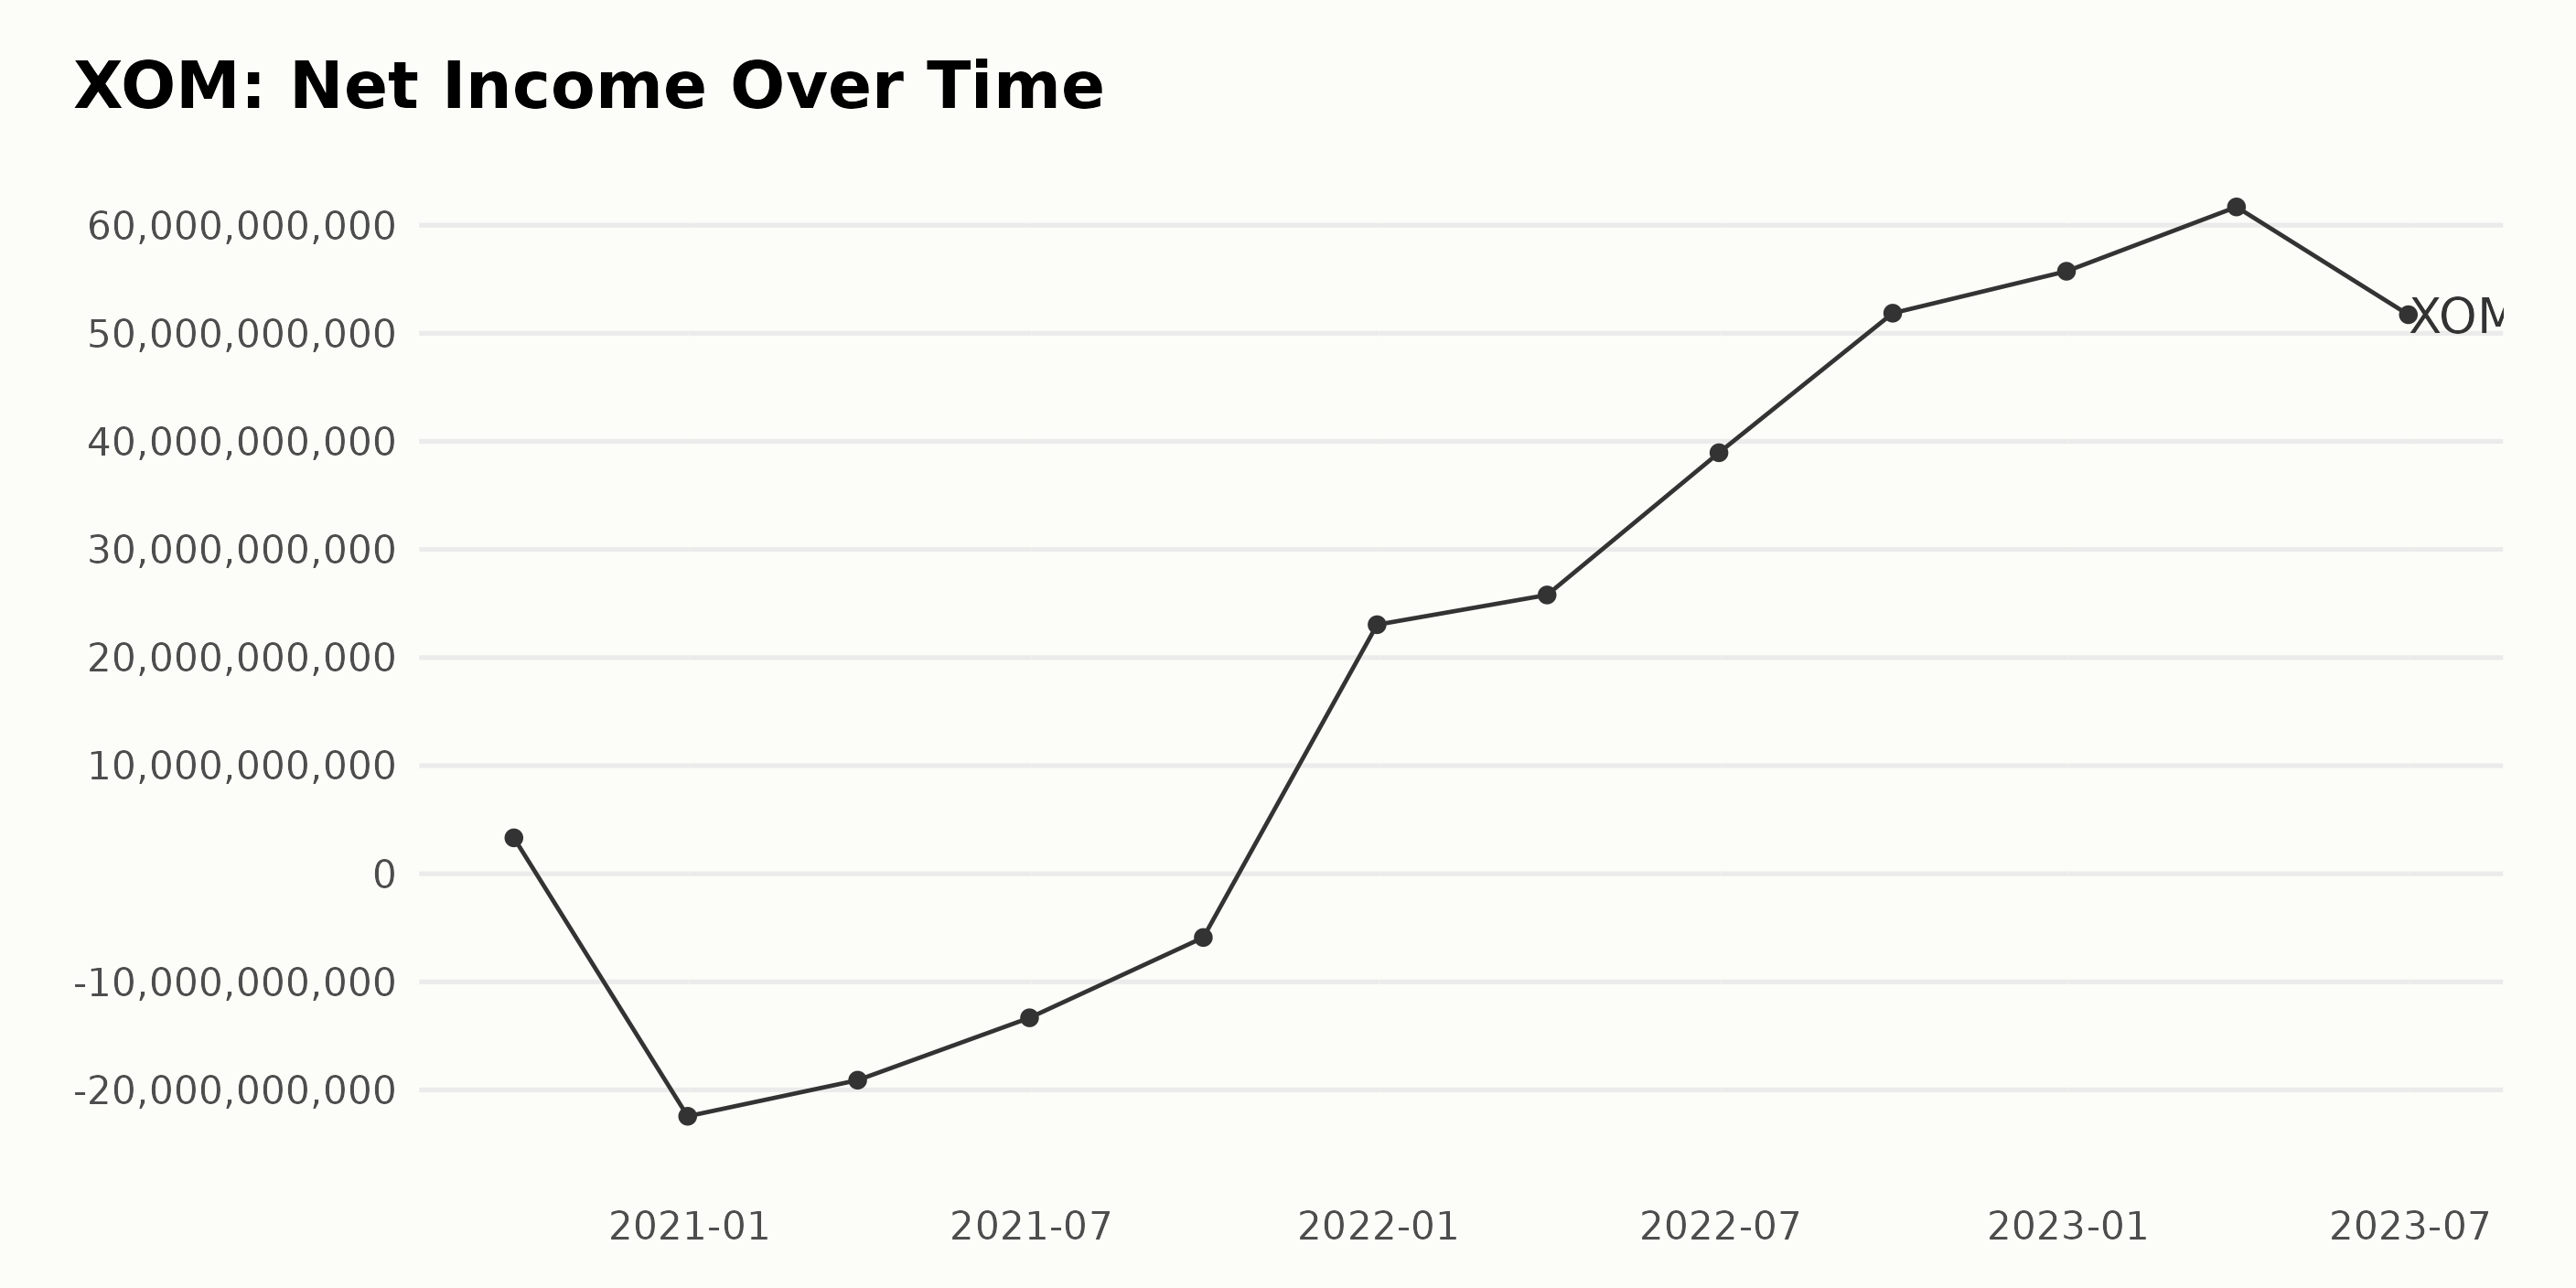
The data provided illustrates the significant fluctuations in XOM's trailing-12-month net income over the period from September 2020 to June 2023.
- The trend initiated in September 2020 demonstrated a net income of $3.32 billion.
- A drastic decline was witnessed by December 2020, plunging into negative territory with net income of -$22.44 billion.
- XOM's losses further deepened as the net income auspiciously slid to -$19.1 billion in March 2021 and then progressively improved, albeit staying negative until it bottomed out at -$5.9 billion in September 2021.
- Following this, a noteworthy reversal propelled the net income into positive territory by December 2021 with an impressive surge to $23.04 billion.
- This positive trend carried on throughout 2022, reaching its peak in December that year with a net income hitting $55.74 billion.
- Despite reaching an all-time high of $61.69 billion in March 2023, XOM's net income dropped to $51.72 billion by June 2023.
Observing the trajectory from the series' start to finish point, a strong growth rate can be identified, transitioning from an initial $3.32 billion to a staggering $51.72 billion.
Overall, while XOM's journey within the evaluated period has been characterized by significant volatility, the profitability trend pointed upwards, emphasizing the company's robust economic recovery following periods of severe financial strain.
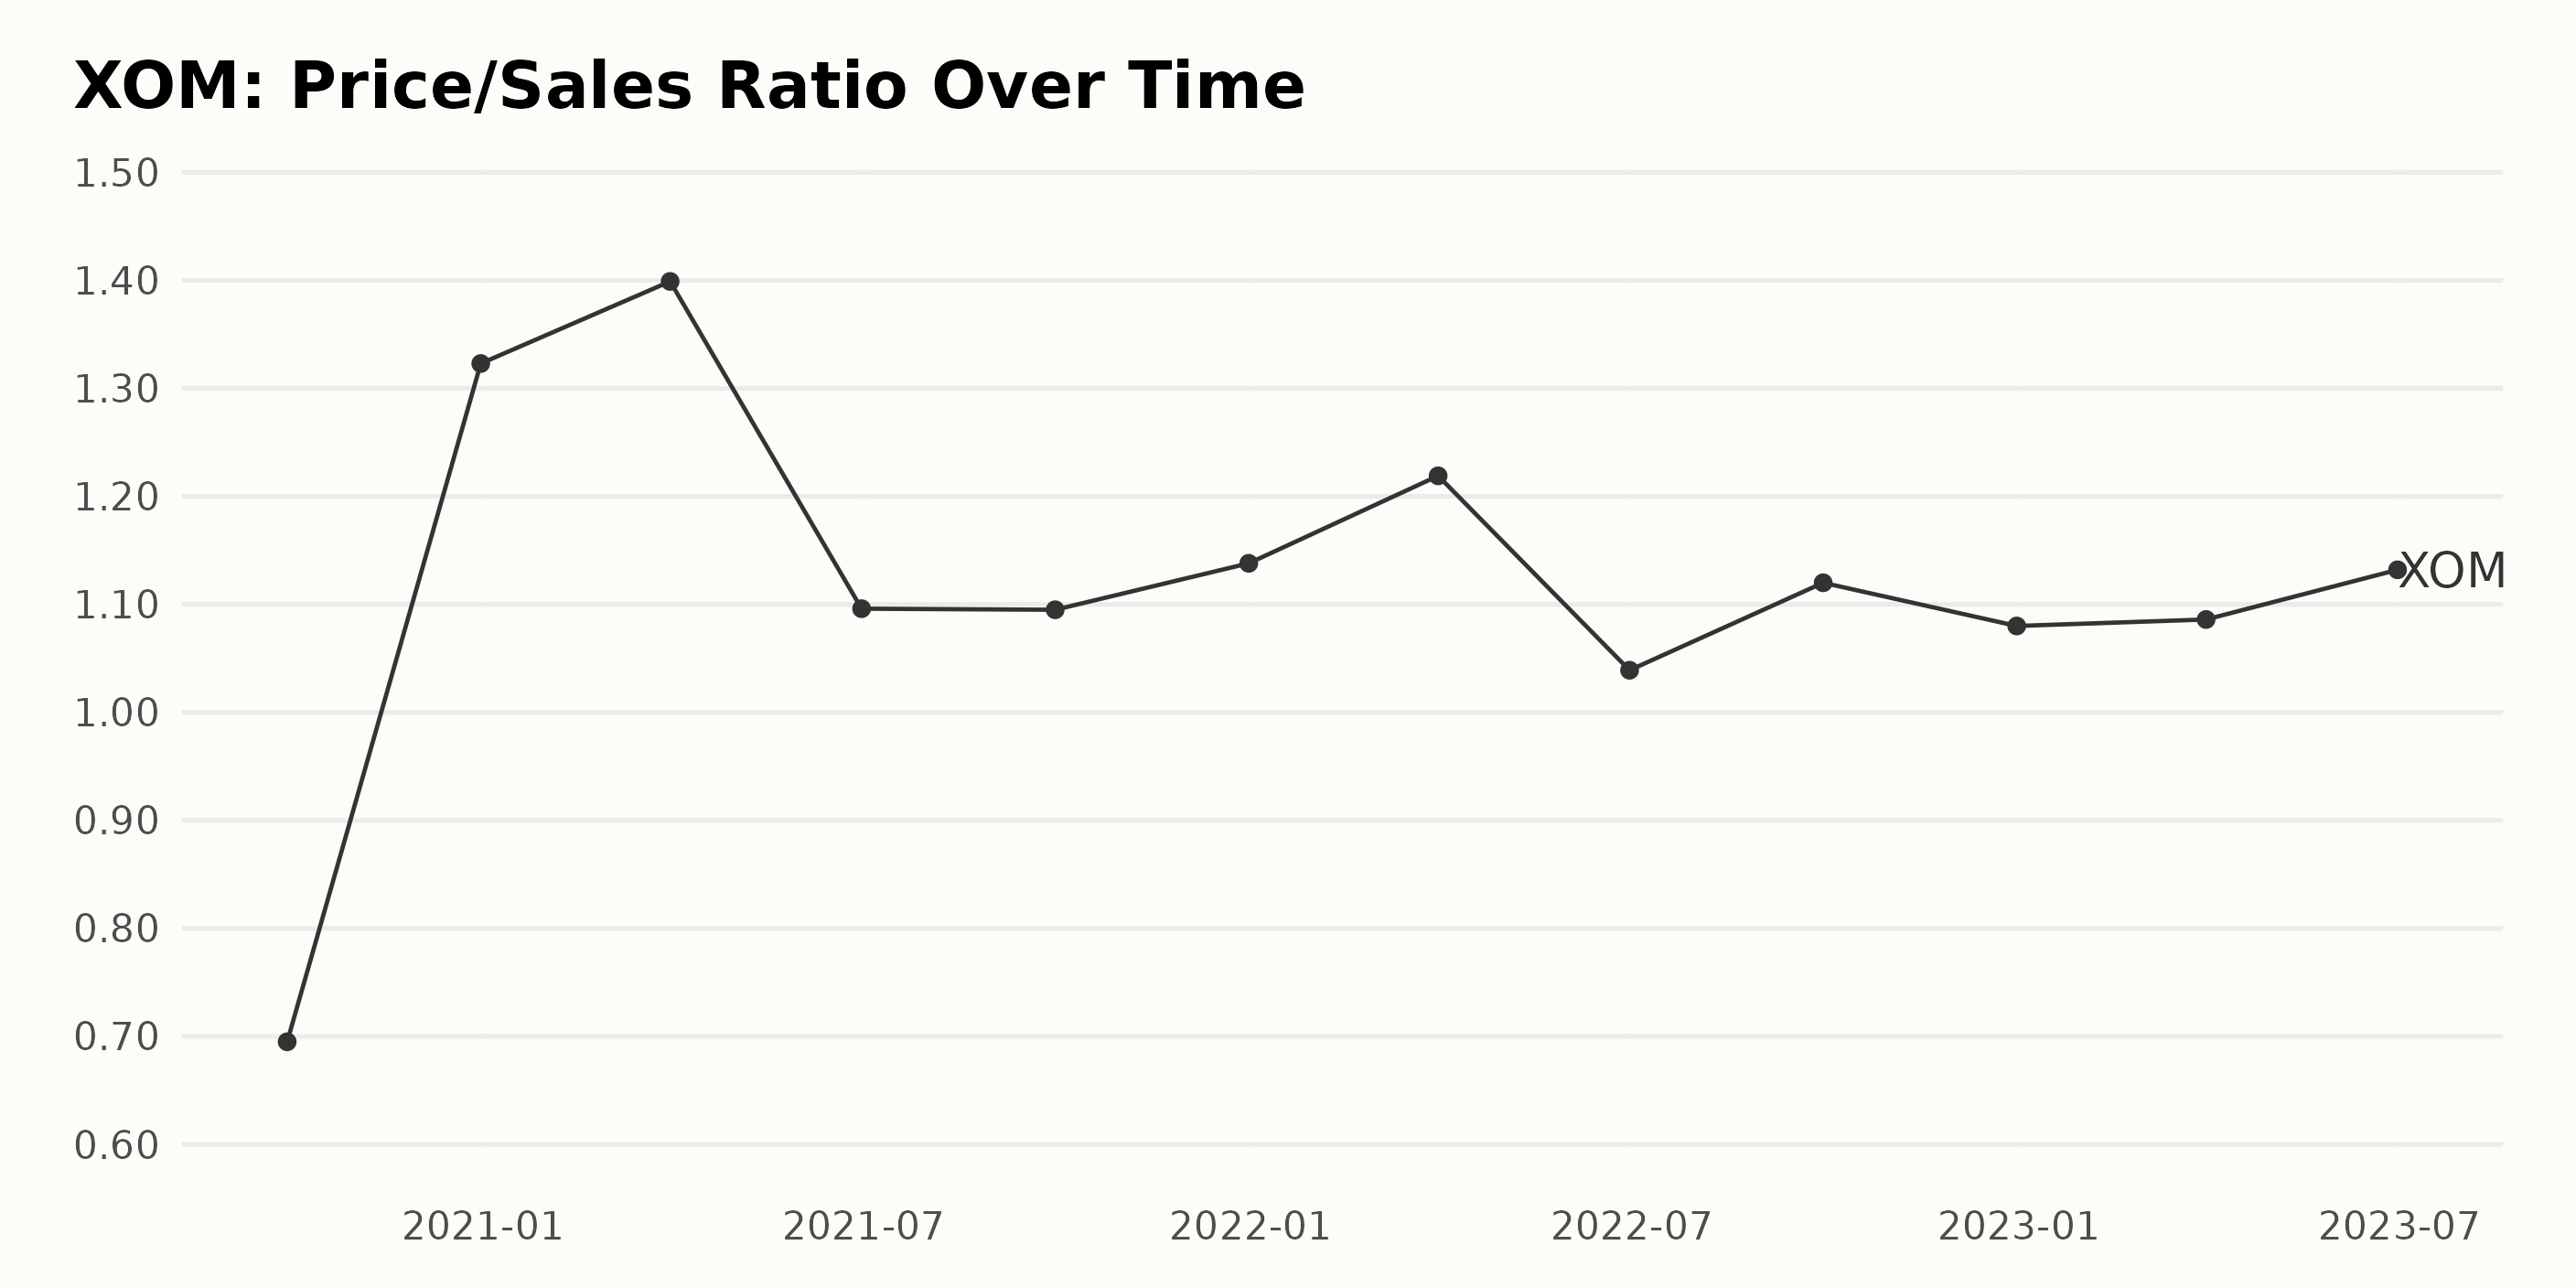
XOM's Price/Sales ratio (P/S) has experienced various fluctuations over the presented period. These fluctuations are summarized below:
- In late 2020, there was a significant increase in the P/S from 0.695 in September to 1.323 in December.
- After reaching a peak of 1.399 in March 2021, the P/S underwent a decrease in June 2021, falling to 1.096. It remained nearly constant at this state until the close of 2021.
- From the start of 2022 to mid-year, the P/S displayed a shorter period of rise and fall, going from 1.219 in March to 1.039 in June.
- Recently, a slight increase was observed as the P/S rose to 1.12.
Latest Value: As of June 30, 2023, the P/S stands at 1.132. Growth Rate: Comparing the first and last values, we observe that the P/S has grown from 0.695 to 1.132. This represents an overall growth rate of approximately 62%.
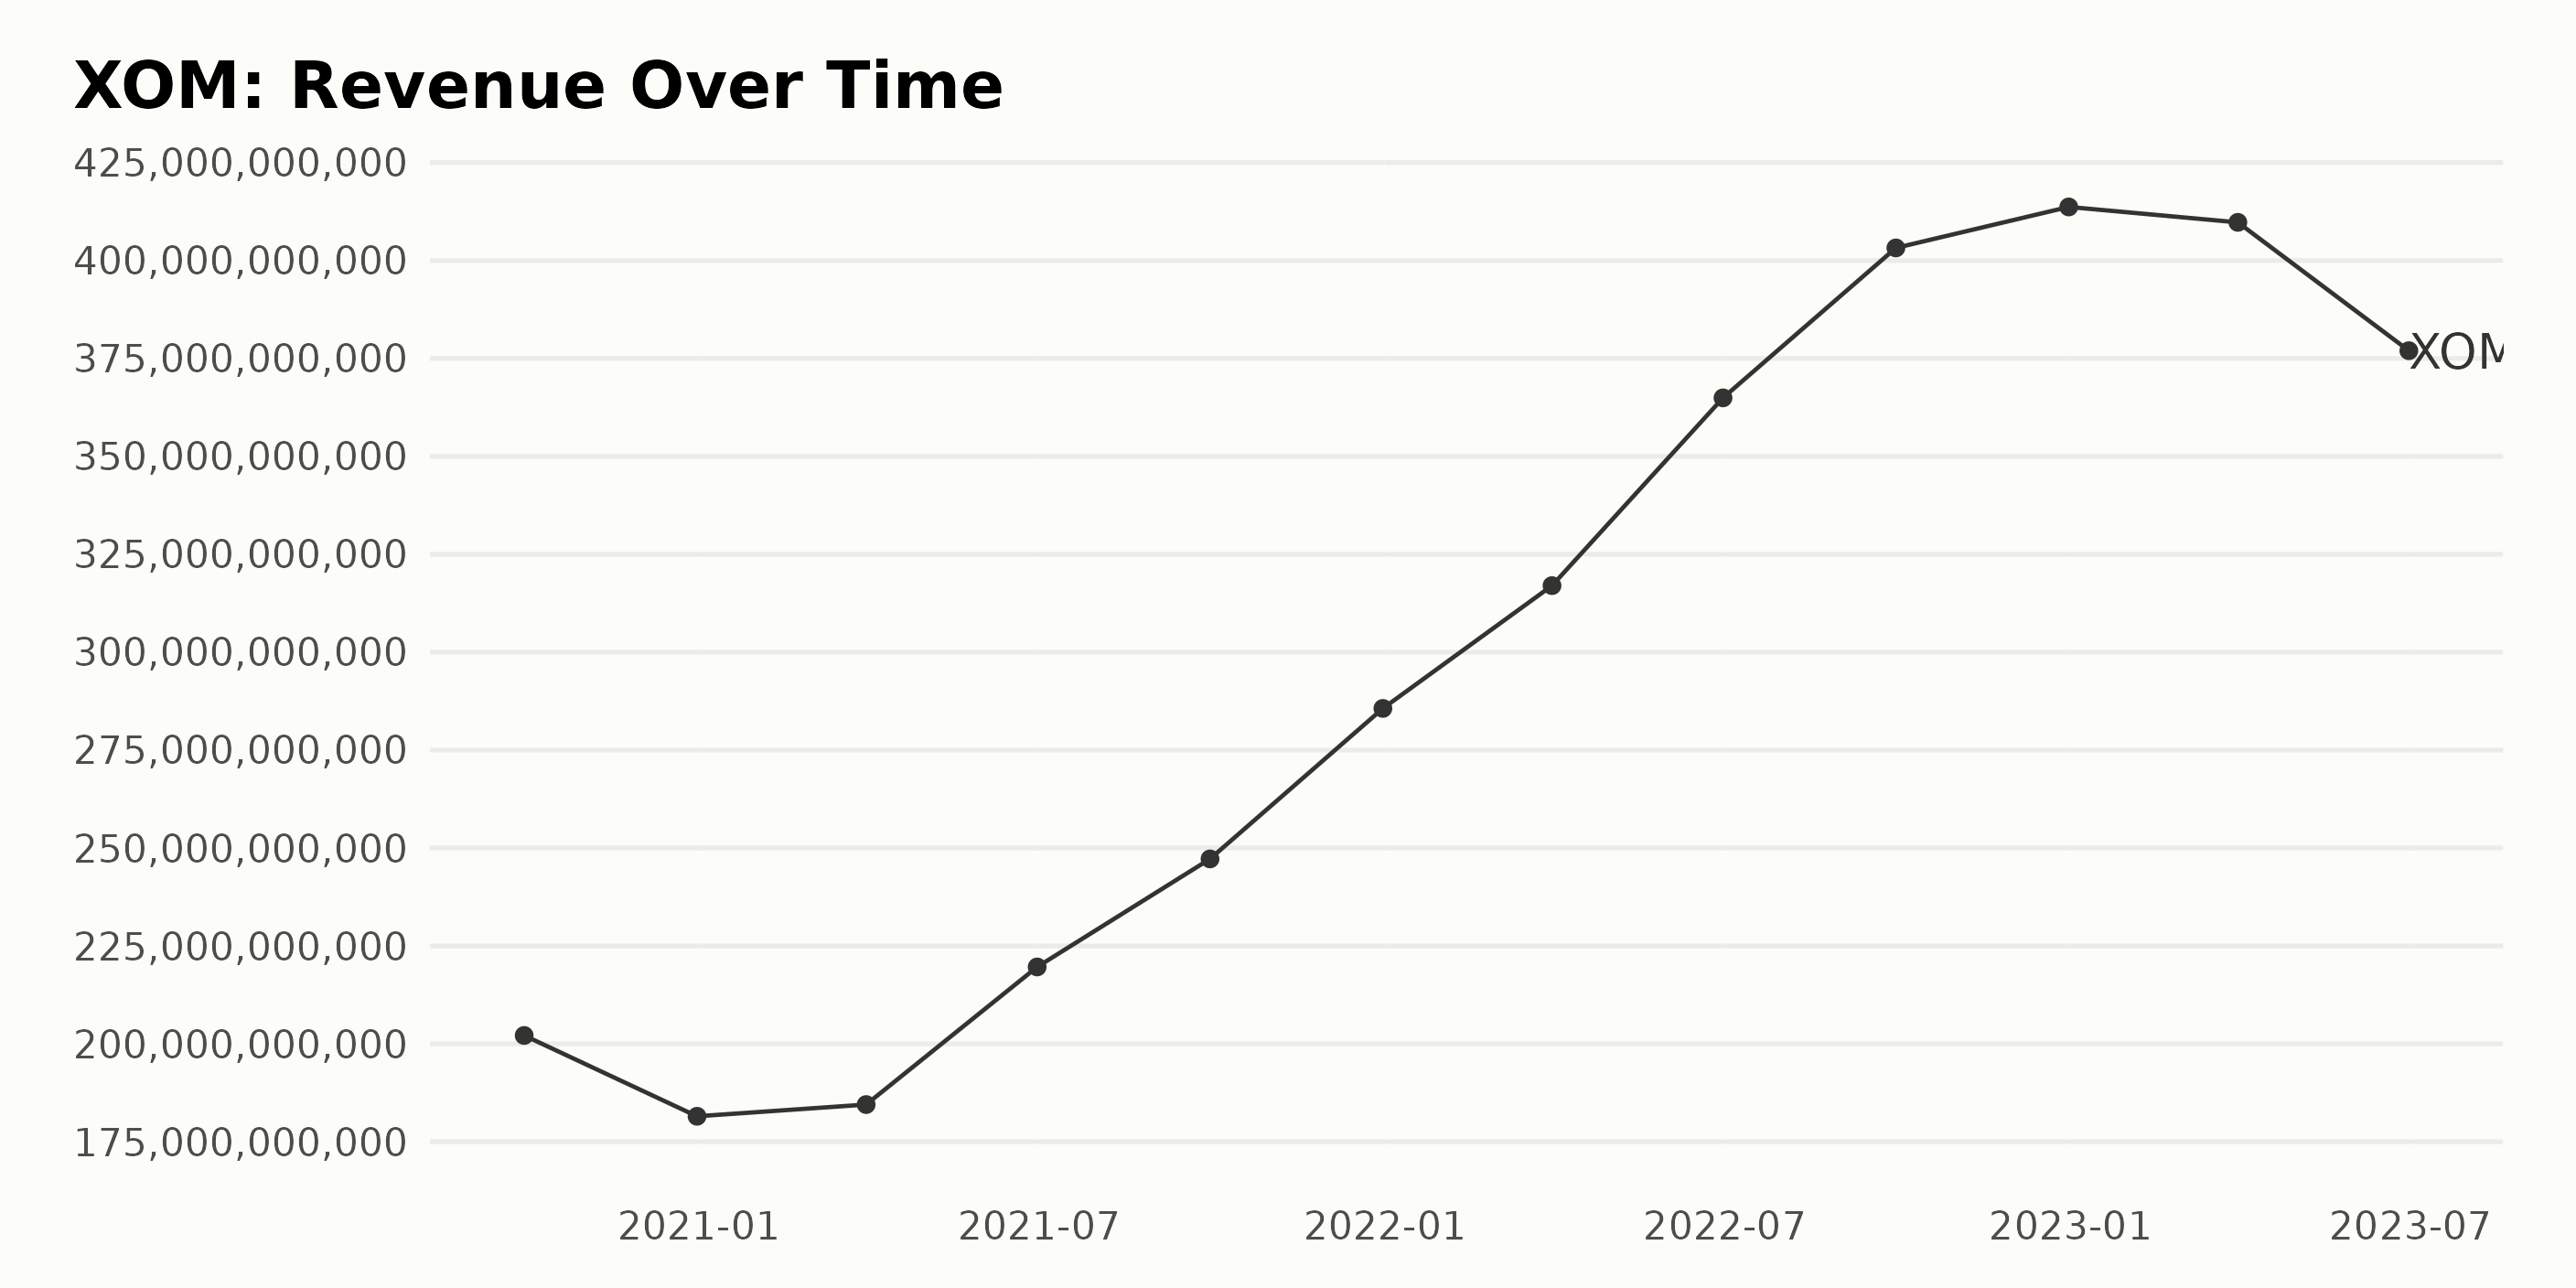
The trailing-12-month revenue trend of XOM shows consistent growth over the reported period, from September 30, 2020, to June 30, 2023. However, certain fluctuations occurred over the years.
- On September 30, 2020, the revenue stood at $202.14 billion.
- There was a slight dip to $181.50 billion by December 31, 2020.
- The subsequent quarters in 2021 reported a gradual increase, with revenue peaking at $285.64 billion by December 31, 2021.
- In 2022, the company's performance showed more robust growth. On March 31, 2022, the revenue was $316.99 billion. This grew steadily and reached a zenith of $413.68 billion by the end of 2022.
- The first half of 2023 marked a decline period for revenue. From $409.74 billion on March 31, 2023, it fell to $376.98 billion on June 30, 2023.
The final figure reported is $376.98 billion on June 30, 2023, compared to the first record of $202.14 billion on September 30, 2020. This marks a significant overall growth in XOM’s revenue over this period.
The calculated growth rate from the first to the last recorded value is approximately 86.38%, which highlights the upward trajectory of XOM's financial performance despite periodic fluctuations.
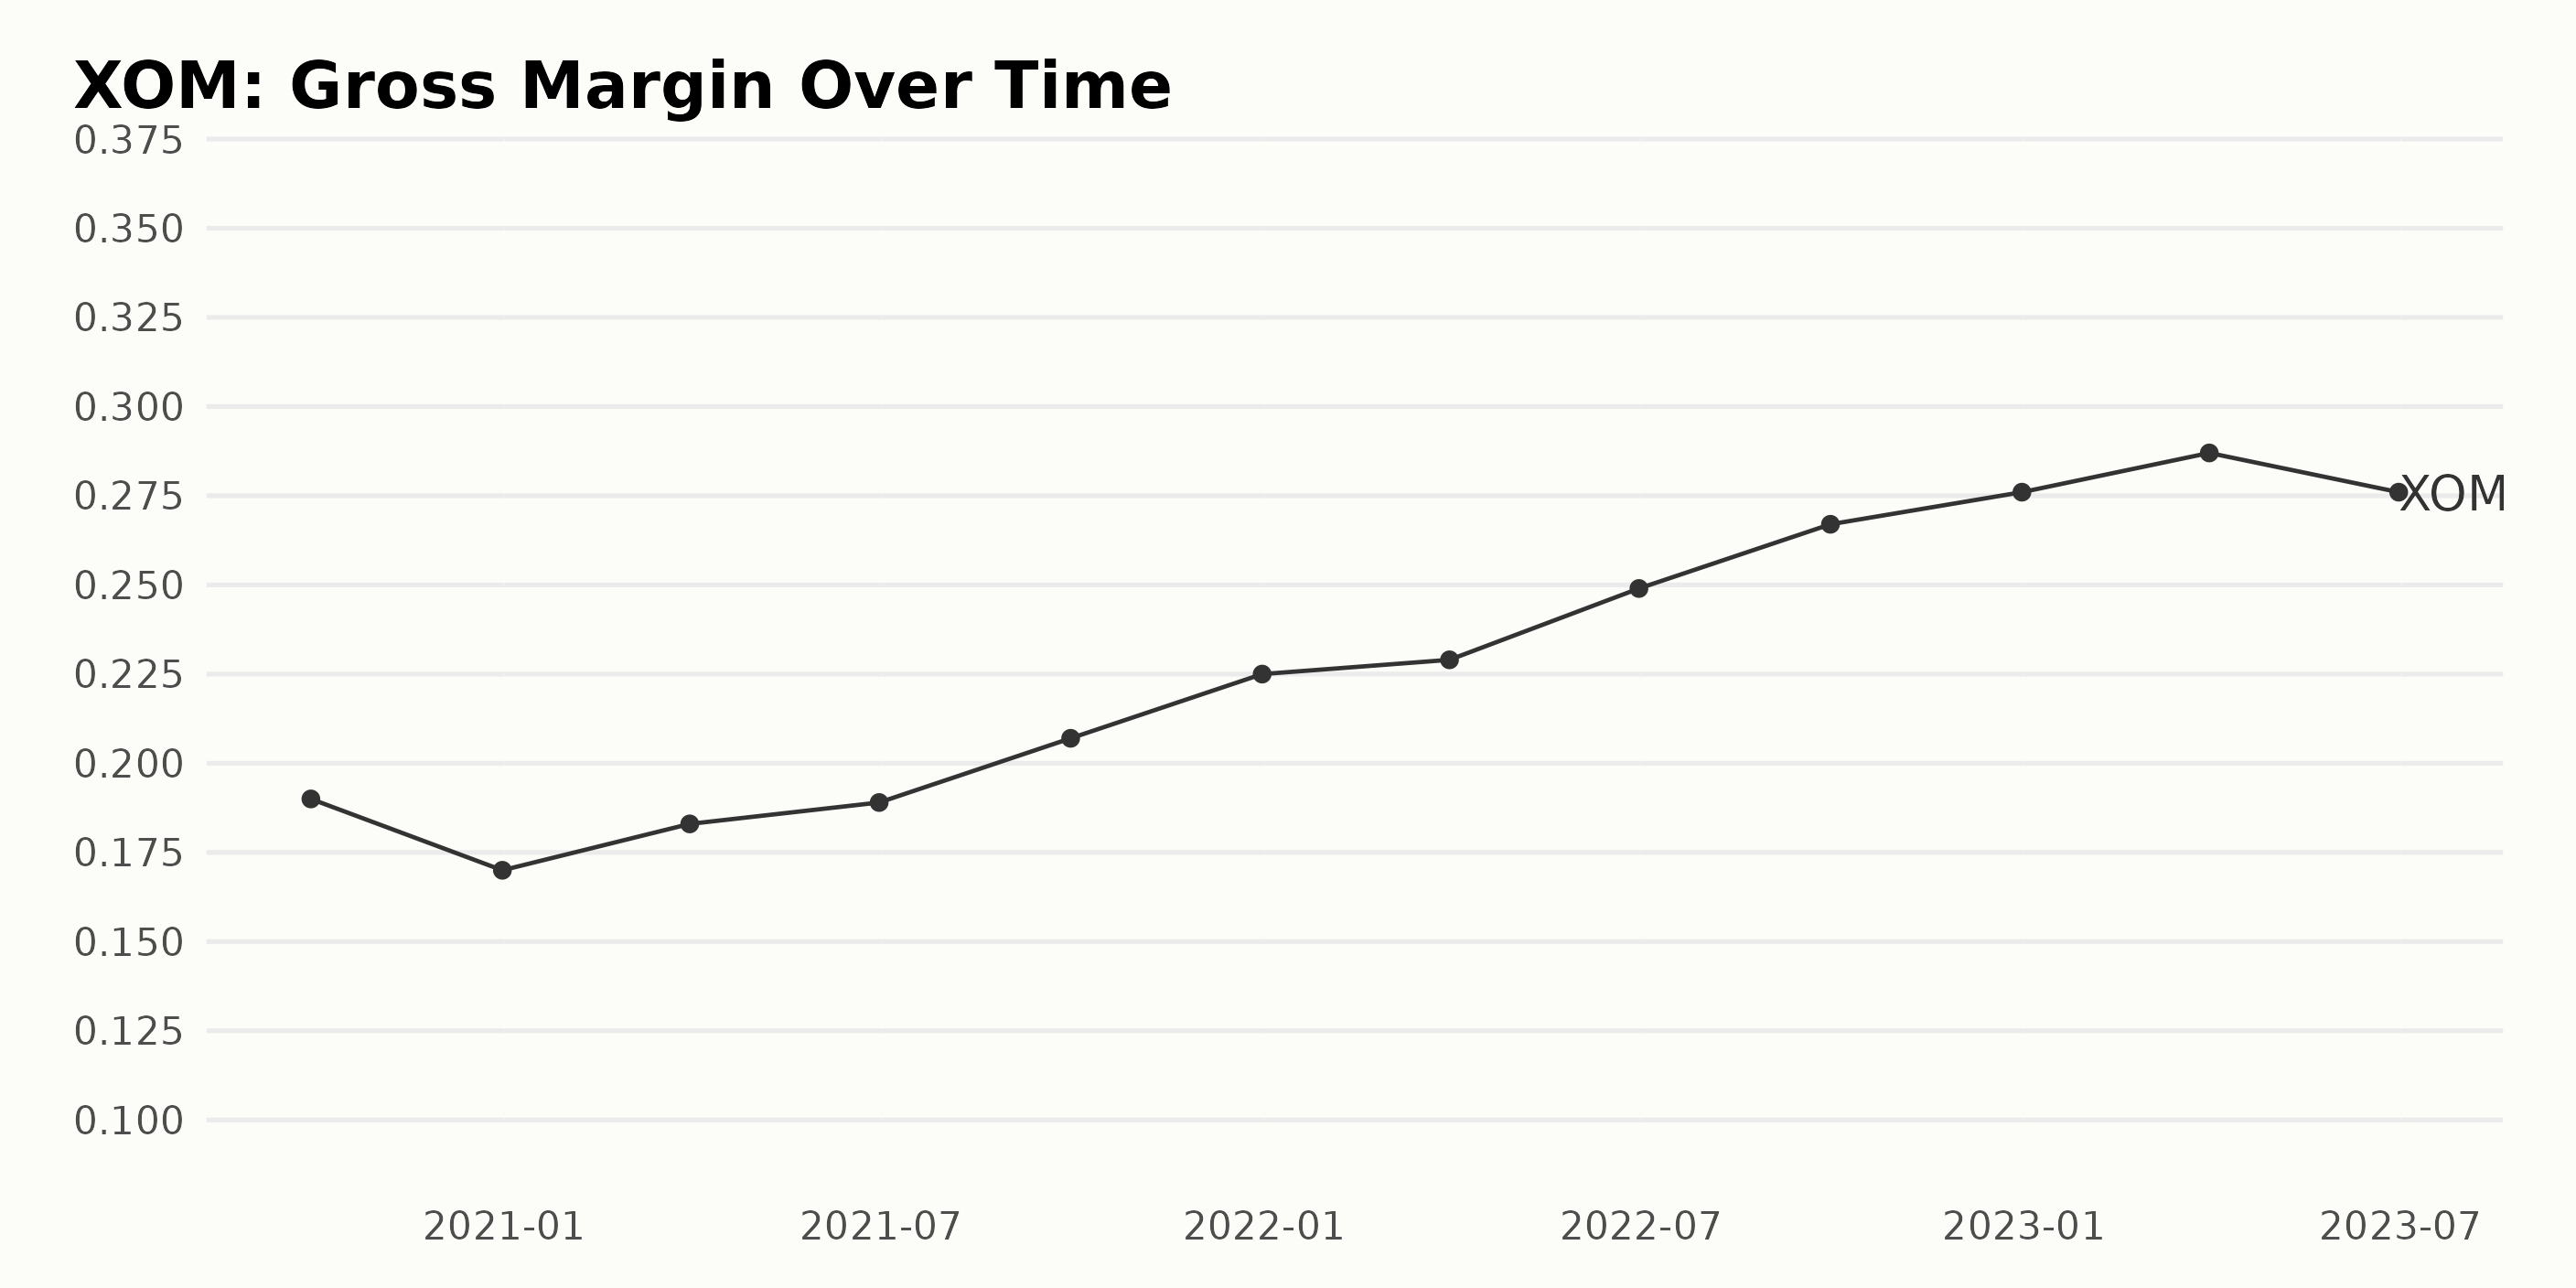
The summary of the gross margin reported by XOM based on the provided data series is as follows:
- In September 2020, the gross margin was at 19.0%.
- A slight decrease was observed by the end of the year, December 2020, with the gross margin dropping to 17.0%.
- Toward the beginning of 2021, there was a slight increase in gross margins to 18.3% in March.
- As the year progressed, there were consistent increases in gross margins; 18.9% in June, 20.7% in September, and 22.5% by the end of 2021.
- Moving in 2022, an upward trend continued with gross margins of 22.9% in March, 24.9% in June, and 26.7% in September. The year ended with a gross margin of 27.6%.
- In the first quarter of 2023, the gross margin saw an increase to 28.7% but experienced a downtick to 27.6% in June 2023.
Overall, the gross margin for XOM has seen a growth from 19.0% in September 2020 to 27.6% in June 2023, indicating an upward trend. This represents a growth rate of approximately 45.3% over the given period.
However, fluctuations were also observed in this period, with slight decreases in gross margins at certain points. The emphasis is placed on more recent data, where there is a significant increase in gross margin values, suggesting improved profitability for the company.
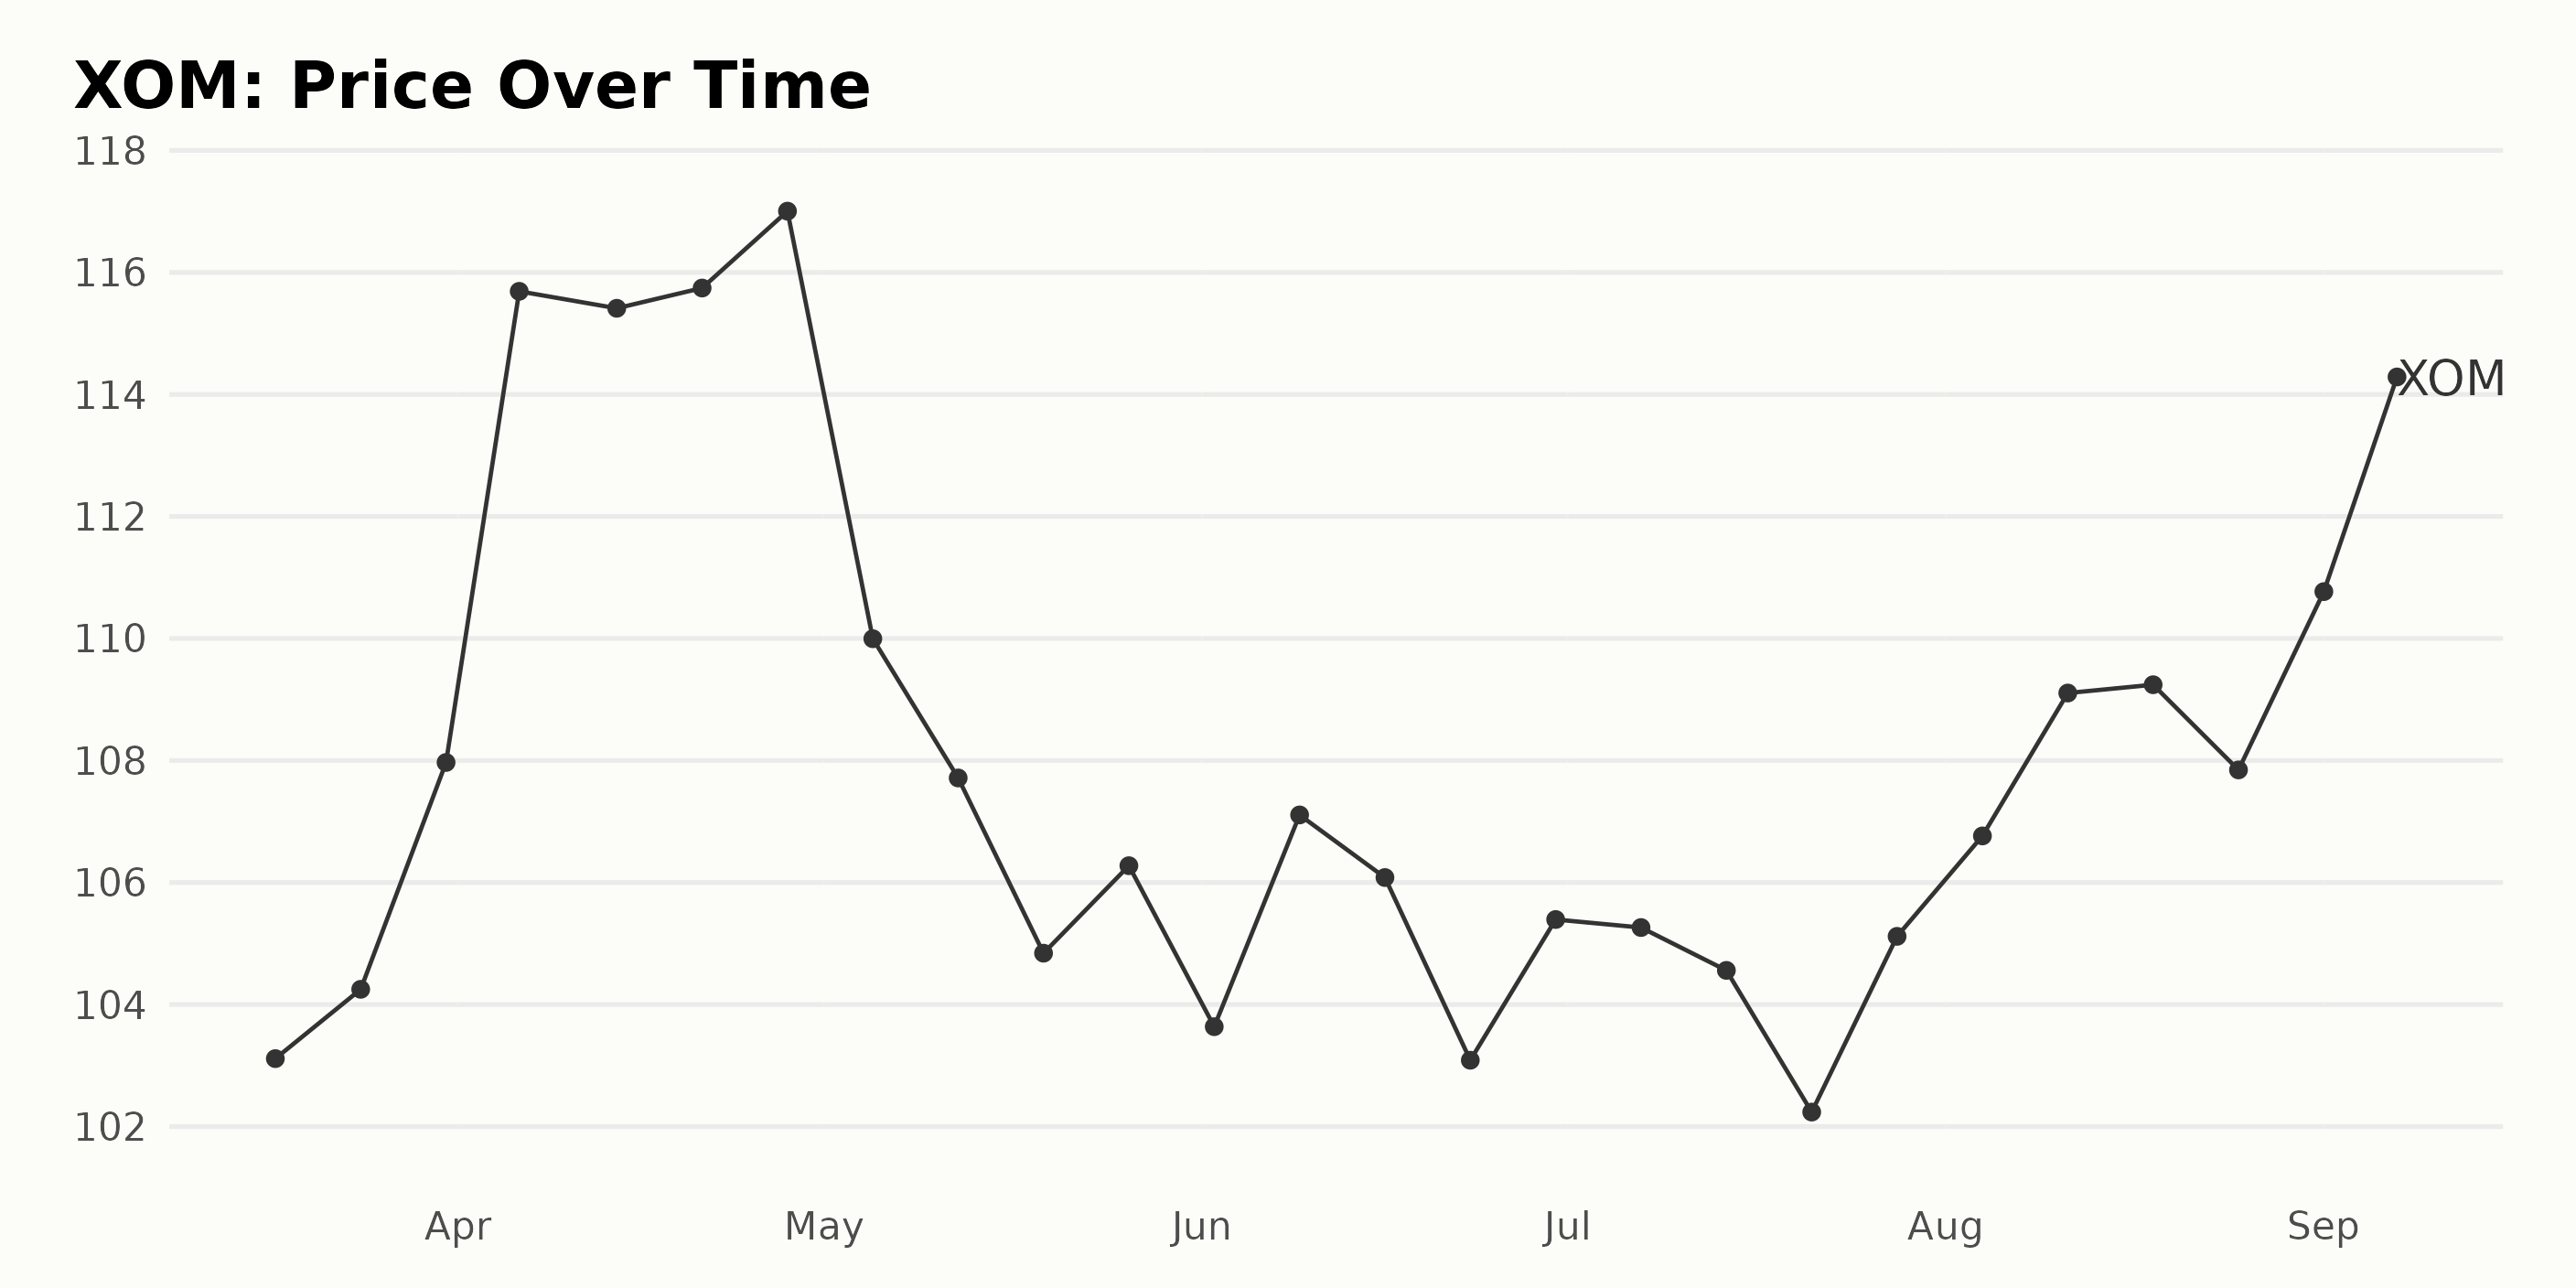
Analyzing Exxon Mobil Corporation's Share Price Volatility: March to September 2023
The following observations can be made regarding the share price of XOM based on the provided data:
- At the beginning of the observed period, on March 17, 2023, the share price of XOM was $103.11.
- The highest price reached during the observed period was $117.00 on April 28, 2023.
- Following the peak in April, there was a significant decrease in May, with a low price of $104.84 by the end of the month.
- The price slightly recovered in June, hovering around the $105-$107 range.
- In July 2023, the price dropped to its lowest in the observed period at $102.24 on July 21.
- There was an upward trend starting from August, reaching $110.77 by September 1, 2023.
- The observed period ended on a high note, with the price reaching $113.95 on September 7, 2023.
The overall trend of XOM for this period shows some volatility with several peaks and troughs. Initially, there is a rapid increase from March to April, which then declines from late April to July. However, from August onwards, there is a steady rise in the share price. Here is a chart of XOM's price over the past 180 days.
Exxon Mobil's POWR Ratings: Momentum, Quality, and Increasing Stability Trends
The POWR Ratings grade for XOM, which belongs to the Energy - Oil & Gas category, has consistently maintained a steady grade of C (Neutral) throughout the period discussed. This category consists of 87 stocks in total. Here are some important points:
- For the week of March 18, 2023, XOM held a rank of #47 within its category.
- A slight improvement was seen by the week of March 25, 2023, as it moved to the #43 position.
- The stock showed fluctuation in its ranking in April 2023 and May 2023, but the grade remained unchanged at C (Neutral).
- By the week of May 20, 2023, XOM had improved its rank significantly to the #34 position.
- This improvement continued until the end of May but slightly decreased again through June, July, and the start of August 2023.
- During the remaining time in August 2023 and moving into September 2023, the rank alternated between the mid-40s and high 30s.
- The most recent data from September 8, 2023, places XOM at the #39 position in its category.
It is worth noting that despite rounds of market flux, the POWR grade for XOM remained constant throughout the period. However, the rank within its category displayed consistent fluctuations, reflecting the competitive dynamics of the Energy - Oil & Gas category.
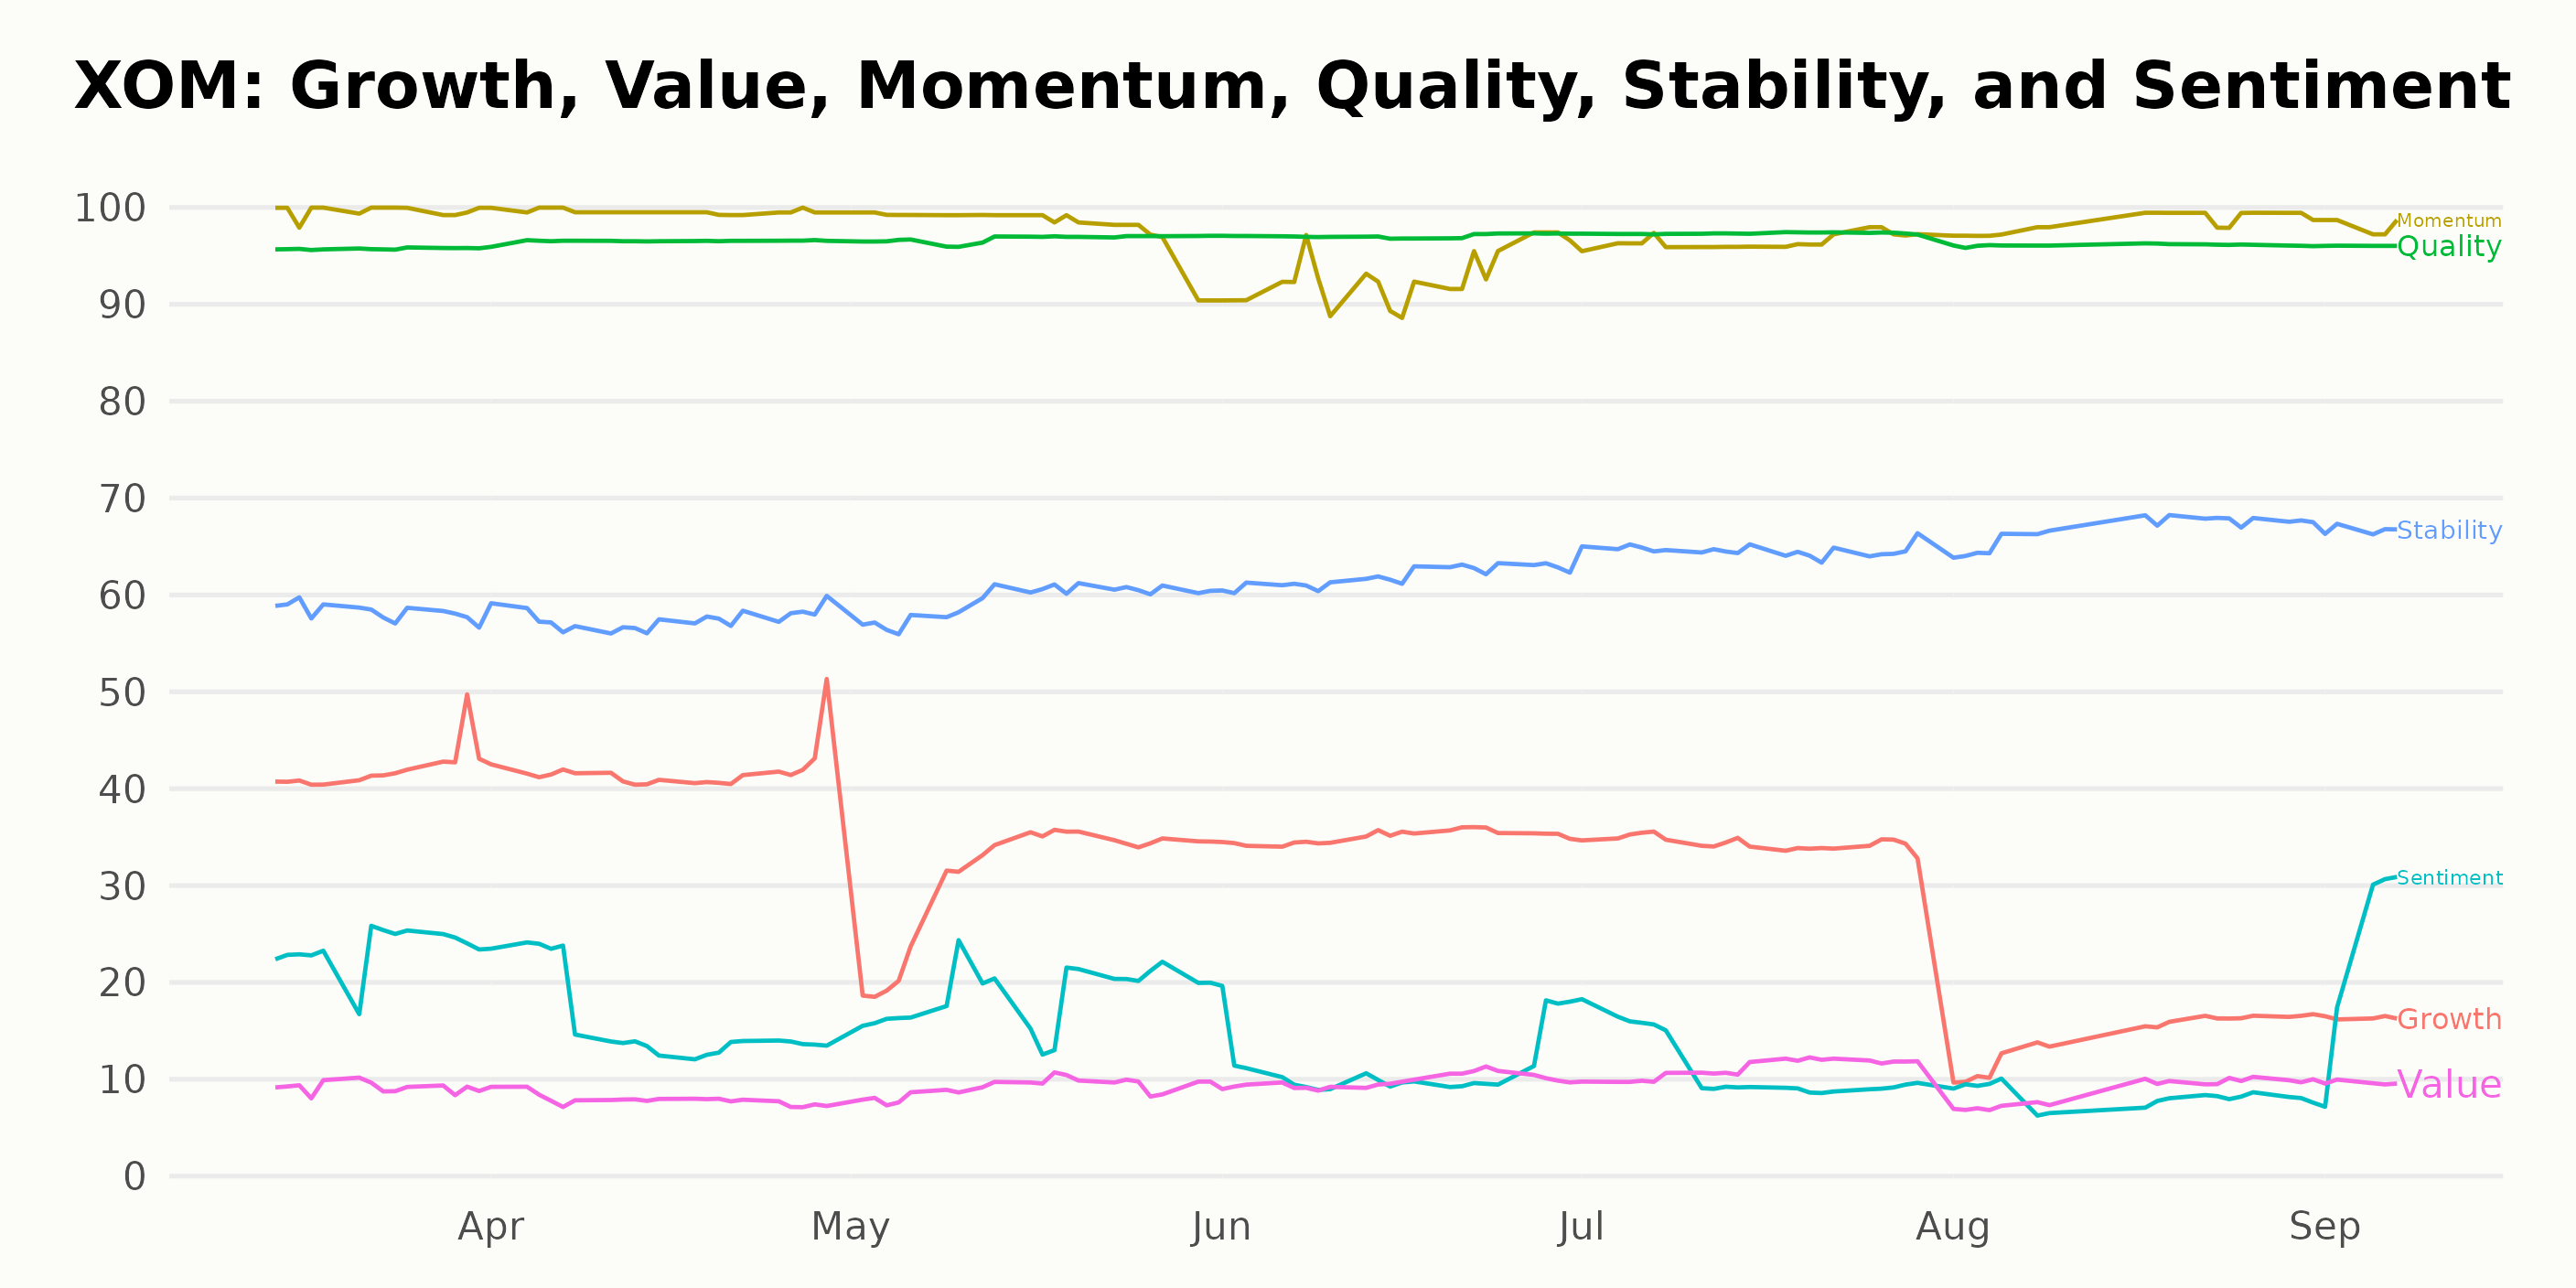
The POWR Ratings for XOM indicate three dimensions of particular interest: Momentum, Quality, and Stability.
- Momentum: Throughout the timeframe, XOM shows a consistently high rating in Momentum, peaking at 100 in March and April 2023 and remaining high, though it dips slightly to a still-strong 93 in June. However, it quickly picked up, reaching 98 by the end of August 2023.
- Quality: Quality is another strong dimension for XOM. It maintains a steady 96-97 rating from March to August 2023, revealing a consistent strength in this area.
- Stability: The Stability dimension is noteworthy for its clear upward trend. Starting with a score of 58 in March 2023, XOM's Stability improves gradually, reaching 67 by August 2023.
In summary, Momentum and Quality remain consistently high for XOM over the period, while Stability shows a clear increasing trend.
How does Exxon Mobil Corporation (XOM) Stack Up Against its Peers?
Other stocks in the Energy - Oil & Gas sector that may be worth considering are Cheniere Energy, Inc. (LNG), Weatherford International plc (WFRD), and CVR Energy, Inc. (CVI) - they have better POWR Ratings. Click here to explore more stocks in the Energy - Oil & Gas sector.
43 Year Investment Pro Shares Top Picks
Steve Reitmeister is best known for his timely market outlooks & unique trading plans to stay on the right side of the market action. Click below to get his latest insights…
Steve Reitmeister’s Trading Plan & Top Picks >
XOM shares were trading at $115.81 per share on Friday afternoon, up $1.86 (+1.63%). Year-to-date, XOM has gained 7.60%, versus a 17.43% rise in the benchmark S&P 500 index during the same period.
About the Author: Anushka Dutta

Anushka is an analyst whose interest in understanding the impact of broader economic changes on financial markets motivated her to pursue a career in investment research.
September Gameplan for Exxon Mobil (XOM) StockNews.com