A strong S&P 500 stock market lifts American citizens by boosting wealth, confidence, and economic opportunities. Higher stock prices increase the value of retirement accounts, investments, and pensions, giving people more financial security and spending power. Companies benefit too, as rising stock values make it easier to raise capital for growth, which can lead to more jobs and innovation. If prices keep climbing, we can expect stronger consumer spending, improved business investment, and a more robust economy.
Will the upcoming bullish seasonal pattern set the stage for this continued growth?
Interest Rates
The Federal Reserve is expected to initiate a lower interest rate cycle in the last quarter of 2025, with market data indicating a Fed Funds rate of 3.75-4.00% by year's end, currently at 4.25-4.50%. Lower rates reduce business borrowing costs, enabling expansion and hiring, which supports corporate earnings and stock prices. The S&P 500 has historically risen in response to rate cuts.
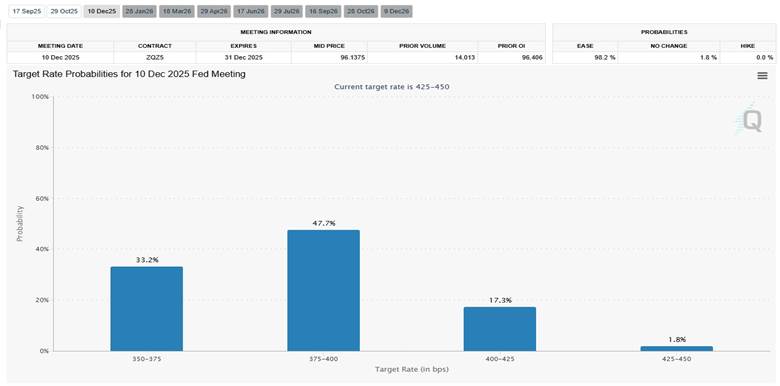
Source: CME Group Exchange
This environment fosters optimism among investors, driving capital into equities, particularly in sectors like financials, industrials, and energy, which have outperformed during past rate-cutting periods. This signals a potential opportunity for professional traders to increase exposure to U.S. equities, especially in growth-sensitive sectors, as lower rates stimulate economic activity and boost market confidence.
Historically Strong Period
The fourth quarter has historically been strong for the U.S. stock market, with the S&P 500 averaging a 4.1% return from October to December since 1950. Seasonal factors like holiday spending, corporate earnings releases, year-end capital inflows, and portfolio rebalancing contribute to this strength.
Less Demand for Safe-Haven Currencies
Seasonally, the last quarter usually sees safe-haven currencies being out of favor, characterized by a seasonal pattern of weakness in the Japanese Yen and Swiss Franc, with historical data showing the Yen declining by an average of 2.3% and the Franc by 1.8% against the U.S. dollar from October to December (2000–2020). This seasonal weakness suggests investors are less likely to seek these currencies as safe havens, reducing the typical flight-to-quality demand. Instead, market dynamics may favor U.S. assets, as traders anticipate continued equity strength, particularly in the S&P 500. As professional traders lean into U.S. equities, there could be opportunities while monitoring Yen and Franc movements for currency strategies.
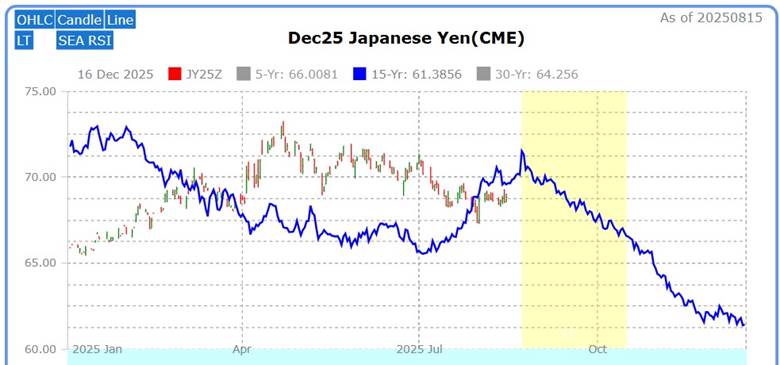
Source: Moore Research Center, Inc. (MRCI)
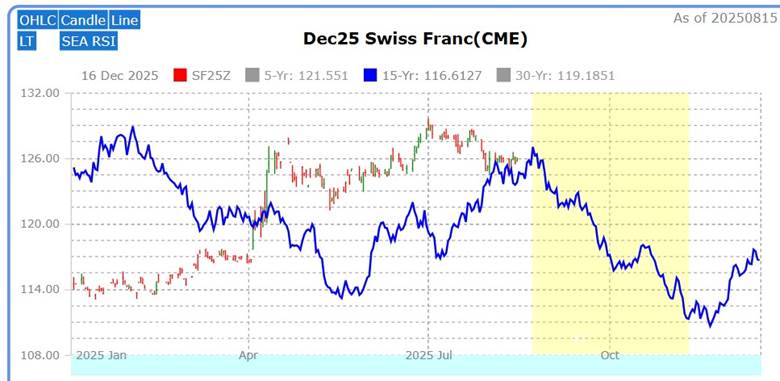
Source: MRCI
MRCI research reveals a 15-year seasonal pattern (blue line) that sees weaker prices for both currencies in the last quarter of the calendar year.
Technical
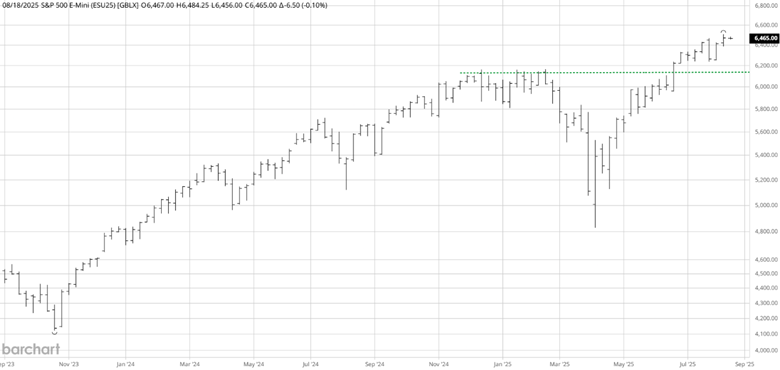
Source: Barchart
The S&P 500 has had a significant rally from the April 2025 lows. As the seasonal buy window approaches in late August, the S&P 500 may experience some sideways to down correction activity. During this seasonal buy window, traders may find the January 2025 previous all-time high area (green line) as potential support.
Seasonal Pattern
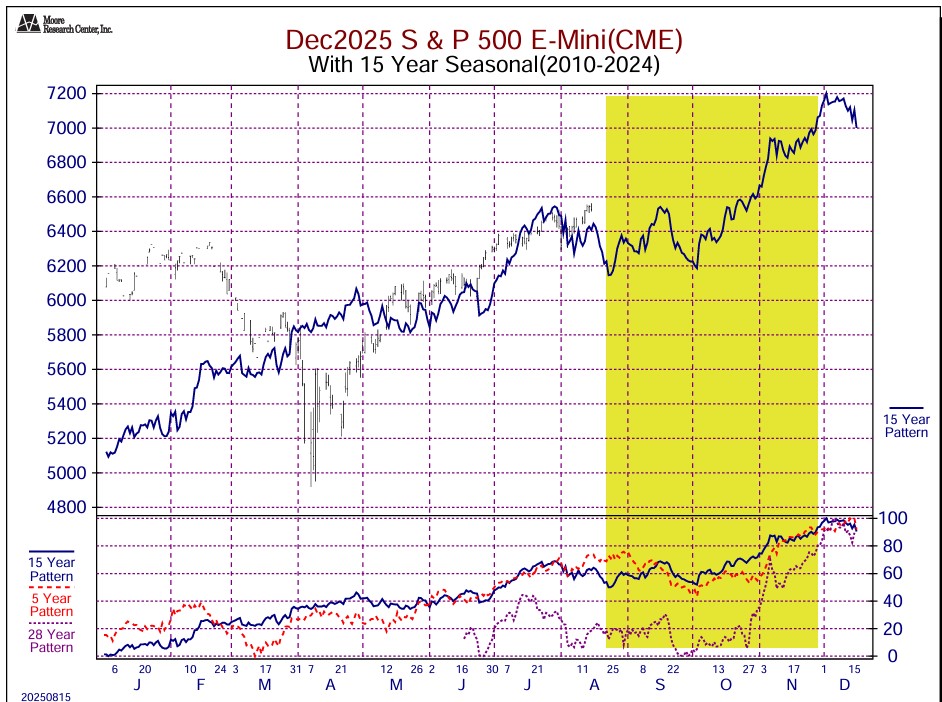
Source: MRCI
The seasonal window (yellow box) opens in August, while the September mini-S&P is still the front month. However, by the end of the seasonal window, December will be the front-month contract. The seasonal window will open, but the price does not go straight up. Some years, the pattern has been sideways to higher until the end of September. This allows traders to build long positions or wait for an established uptrend.
Source: MRCI
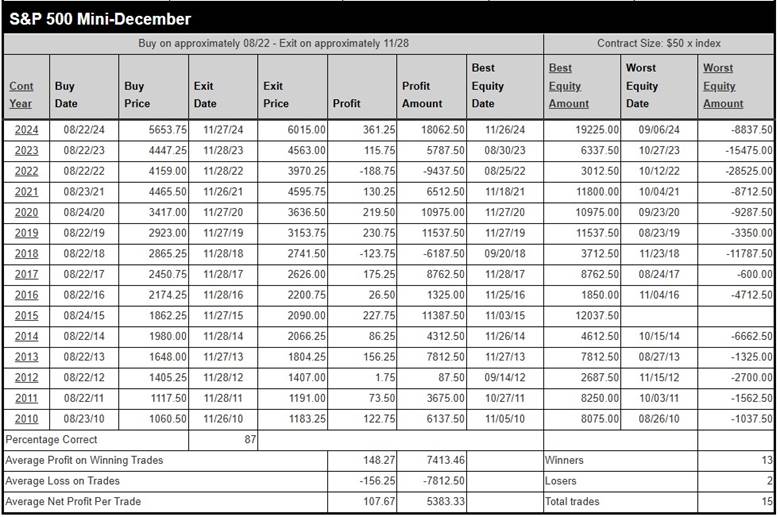
Through extensive research, MRCI has found that the December mini-S&P contract has closed higher on about November 28 than on August 22 for 13 of the past 15 years, an 87% occurrence rate. The hypothetical winning trades averaged 107 points, $5,383.
As a crucial reminder, while seasonal patterns can provide valuable insights, they should not be the basis for trading decisions. Traders must consider various technical and fundamental indicators, risk management strategies, and market conditions to make informed and balanced trading decisions.
Markets to participate in this opportunity
Equity traders may use the exchange-traded fund (ETF) SPY to participate in this opportunity. At the same time, futures traders could use the mini-contract ES or the micro-contract ET. There are many more vehicles to trade the S&P 500, but these are among the more popular. Also, the S&P 500 is the most liquid index market to trade, allowing for safer executions of your trades.
In closing….
The final months of 2025 offer traders a chance to capitalize on a historically strong S&P 500, which has delivered a 4.1% average return in the fourth quarter since 1950, fueled by holiday spending, earnings releases, and portfolio rebalancing. With the Federal Reserve poised to lower rates to 3.75-4.00% by year-end, per CME Group exchange, and seasonal weakness in the Yen and Franc reducing safe-haven demand, U.S. equities could see sustained momentum, particularly in financial sectors. The December mini-S&P contract has closed higher by late November in 13 of the last 15 years, per MRCI data. Still, early consolidation could push prices down to the former January 2025 all-time highs, offering an opportunity for buying lower. Use SPY, ES, or ET to position for this opportunity, but integrate technicals, fundamentals, and risk management—can you navigate the volatility to capture this potential?