In August 2025, the Russell 2000 Index ETF (IWM), a key benchmark for U.S. small-cap stocks, surged 7%, outpacing the S&P 500's modest 2% gain. In September 2025, the IWM closed at an all-time high exceeding the previous high in November 2024. The IWM 's performance trails the S&P 500 year-to-date, but the gap is narrowing, driven by undervaluation and macroeconomic shifts. For traders, this resurgence underscores the index's role in diversification and sensitivity to the Federal Reserve's anticipated interest rate cuts.
The IWM tracks approximately 2,000 small-cap companies, representing about 10% of the Russell 3000's market capitalization. Its broad exposure to sectors like financials, healthcare, and industrials—less tech-heavy than the S&P 500—offers diversification benefits. Unlike large-cap indices dominated by a few mega-cap tech firms, the IWM 's median market cap of < $1 billion as of June 2025 mitigates concentration risk. This makes it an attractive vehicle for traders seeking exposure to a broader swath of the U.S. economy.
Additionally, FTSE Russell performs an annual reconstitution of its U.S. equity indexes, including the IWM, which concludes on the last Friday of June. Starting in 2026, the reconstitution will become semi-annual, with updates in June and November. During a market rotation, investors shift from one style or sector to another. If they move into smaller companies (a "rotation to small-cap"), the IWM, populated with newly added small-cap stocks, could benefit. The reconstitution process rebalances the index to reflect the latest market conditions, making it more responsive to these shifts.
Did the June 2025 reconstitution provide the fuel to continue pressing the IWM into new highs?
The Federal Reserve's signaled shift toward lower interest rates in September 2025 is a critical catalyst. Small-cap companies, often reliant on floating-rate debt, face higher borrowing costs than large caps. With the CME FedWatch Tool indicating a 90% probability of another quarter-point cut in October 2025, small caps benefit from reduced financing costs and improved equity valuations. Lower rates decrease the discount rate on future cash flows, disproportionately boosting smaller firms with higher growth potential.
As the Fed embarks on a dovish path, the IWM 's recent strength, seasonal tailwinds, and diversification benefits position it as a compelling opportunity for traders navigating a broadening market.
Technical Picture
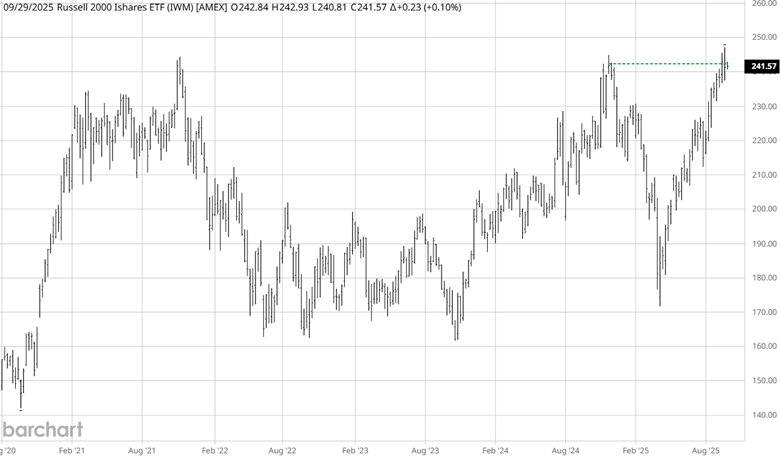
Source: Barchart
The weekly ETF IWM chart shows the recent significant highs of 2021 and 2024. Both have been exceeded on a weekly closing basis. In contrast, the strength of the recent move was quite substantial. Mirroring the other stock indexes, some traders feel the market is overdone. But the trend remains solidly intact.
Assets to Trade the Russell 2000
For stock traders:
iShares Russell 2000 ETF (IWM)
Vanguard Russell 2000 ETF (VTWO)
For futures traders:
Mini-contract (QR)
Micro-contract (RX)
Options are available for both the futures contracts and ETFs.
Seasonal Pattern
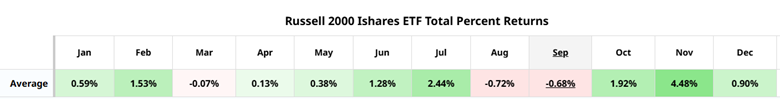
Source: Barchart Seasonal Returns
Research from Barchart shows that the 15-year October and November returns have been the best periods of the year. The fall season has traditionally been a good time for traders to be bullish on stock indexes.
We look at Moore Research Center, Inc. (MRCI) for another view on seasonality.
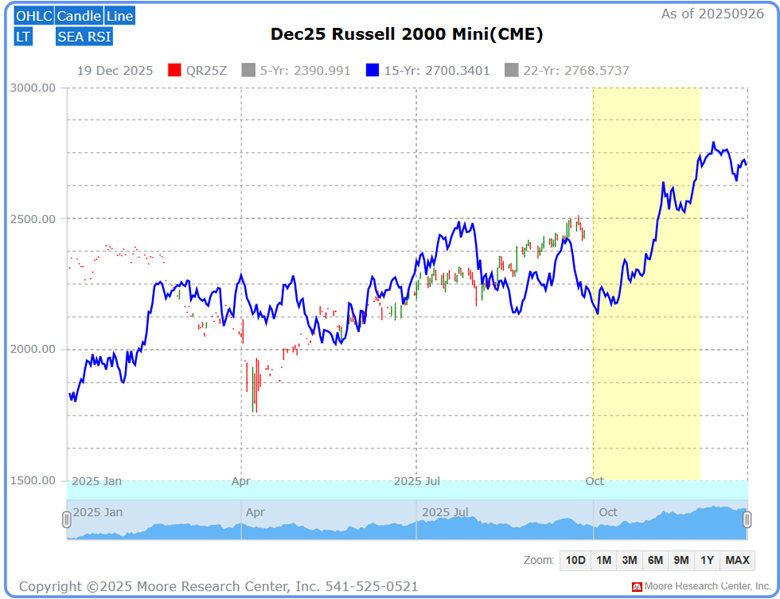
MRCI's research on the past 15 years of the Russell 2000 Index has found a significant low occurs during August (blue line) before a more robust low forms near the beginning of October. The past week has shown a minor correction occurring. The fall season has been a notorious time for stock index volatility. Traders could monitor this correction and begin analyzing the market to find an optimal price to enter the market.
Source: MRCI
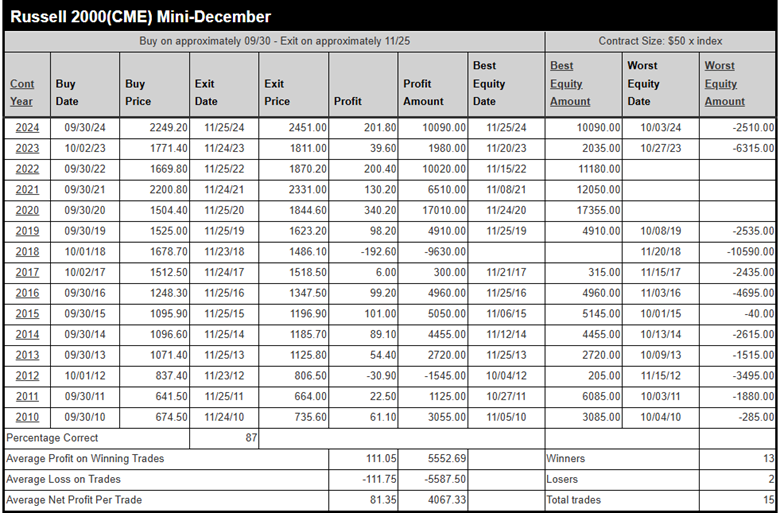
A seasonal window (yellow box) has been found through extensive research at MRCI that reveals the Russell 2000 has closed higher on approximately November 25 than on September 30 for 13 of the past 15 years, with an 87% occurrence rate. During those hypothetically tested 15 years, three did not have a daily closing drawdown. Using the mini futures contract, the test revealed the seasonal pattern had yielded 81 points or $4,067.
Traders could use the seasonal window to either buy near the beginning of the seasonal window and manage the trade through the end of the window. Or, traders could trade on the bullish side in and out of the Russell 2000 market during the seasonal window.
As a crucial reminder, while seasonal patterns can provide valuable insights, they should not be the basis for trading decisions. Traders must consider various technical and fundamental indicators, risk management strategies, and market conditions to make informed and balanced trading decisions.
In closing…
In August 2025, the iShares Russell 2000 ETF (IWM) surged 7%, outpacing the S&P 500's 2% gain, and in September, it closed at an all-time high, surpassing its November 2024 peak. Despite trailing the S&P 500 year-to-date, the IWM's performance gap is narrowing, fueled by undervaluation and the Federal Reserve's anticipated rate cuts, with a 90% chance of a quarter-point cut in October 2025. The IWM's broad exposure to 2,000 small-cap companies across financials, healthcare, and industrials, with a median market cap below $1 billion, offers diversification, mitigating concentration risk compared to tech-heavy large-cap indices. This, combined with seasonal tailwinds and a semi-annual reconstitution starting in 2026, positions the IWM as a compelling vehicle for traders seeking small-cap exposure in a broadening market.
Traders can capitalize on the IWM's bull run using assets like the iShares Russell 2000 ETF (IWM), the cost-efficient Vanguard Russell 2000 ETF (VTWO), or futures contracts like the Mini (QR) and Micro (RX), with options available for both. Historical data from Barchart and MRCI highlights strong seasonal performance, with October and November averaging the highest returns over 15 years, and a reliable pattern where the Russell 2000 closes higher on November 25 than September 30 in 13 of the past 15 years (87% occurrence). While technicals show the trend intact despite a minor correction, traders should combine seasonal insights with technical and fundamental analysis, alongside robust risk management, to navigate potential volatility and optimize entry points.