Friday marked the end of the public hearings for the Royal Commission into the Robodebt Scheme. They painted a picture of a catastrophic program that was legally and ethically indefensible – an example of how technological overreach, coupled with dereliction of duty can amount to immense suffering for ordinary people.
The artificial intelligence (AI) algorithm behind Robodebt has been called “flawed”. But it was worse than that; it broke laws of mathematics. A mathematical law called Jensen’s inequality shows the Robodebt algorithm should have generated not only debts, but also credits.
What was Robodebt?
The Australian government’s Robodebt program was designed to catch people exploiting the Centrelink welfare system.
The system compared welfare recipients’ Centrelink-reported fortnightly income with their ATO-reported yearly income, the latter of which was averaged to provide fortnightly figures that could be lined up with Centrelink’s system.
If the difference showed an overpayment by Centrelink, a red flag was raised. The AI system then issued a debt notice and put the onus on the recipient to prove they weren’t exploiting the welfare system.
A Robodebt victim
To understand the extent of the failure, let’s consider a hypothetical case study. Will Gossett was a university student from 2017-2019. He was single, older than 18, and living at home with his parents.
Will received Centrelink payments according to his fortnightly income from a couple of casual jobs with highly variable work hours. In his first year at university his jobs didn’t pay much, so he received more Centrelink payments in the 2018 financial year than the year following.
The Robodebt algorithm took Will’s ATO yearly income records for both the 2018 and 2019 financial years and, for each year, averaged them into a series of fortnightly “robo” incomes.
Inside Robodebt’s AI world, his fortnightly incomes were then the same throughout the 2018 financial year, and the same throughout the 2019 financial year.
Will was honest with his claims, but was stunned to receive a debt notice for Centrelink overpayments made in the 2019 financial year – the year in which he actually received lower welfare payments.
The income-averaging algorithm gave Will an average fortnightly income for 2019 that was above the threshold that made him eligible for Centrelink payments. As far as the Robodebt system was concerned, Will shouldn’t have received any welfare payments that year.
Jensen’s inequality
The laws of mathematics tell us when two things are equal, but they can also tell us when one thing is bigger than another. This type of law is called an “inequality”.
To understand why and when Robodebt failed for Will, we need to understand a concept called Jensen’s inequality, credited to Danish mathematician Johan Jensen (1859-1925).
Jensen’s inequality explains how making a decision based on the averaging of numbers leads to either a negative bias or a positive bias under a “convexity condition”, which I’ll explain soon.
You’ll recall Will is a single university student, above 18, and living with his parents. Based on these factors, Centrelink has a fortnightly payment table for him, illustrated with the curve in the figure below.
The figure shows the more income Will earns from his jobs, the less welfare payment he receives, until a specific income, after which he receives none.
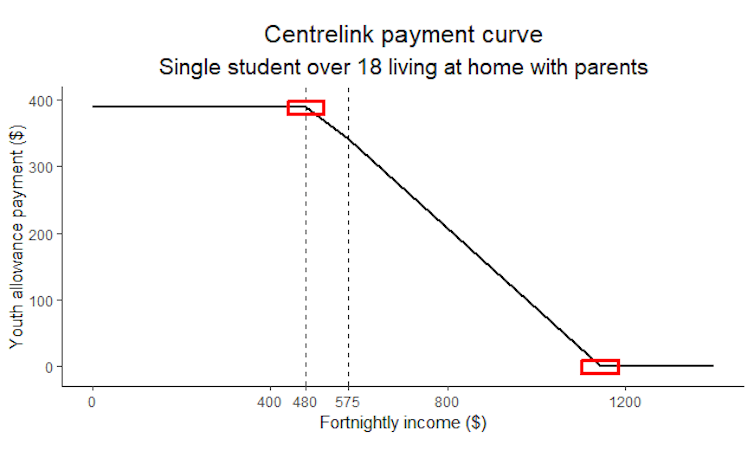
The parts of the curve where Jensen’s inequality is relevant are highlighted by two red squares. In the square on the left, the curve bends downwards (concave), and in the square on the right it bends upwards (convex).
Because Will’s income was higher in 2019 and spread across the part where the payment curve is convex, Jensen’s inequality guarantees he would receive a Robodebt notice, even though there was no debt.
In 2018, however, Will’s income distribution was spread around smaller amounts where the curve is concave. So if Jensen’s inequality was adhered to, the AI algorithm should have issued him a “Robocredit” – but it didn’t.
It could be the algorithm contained a line of code that nullified Jensen’s inequality by instructing any credits be ignored.
Big data and a bad algorithm
The people responsible for the Robodebt system should have had a strong interest in keeping error rates low. Data scientists have a big red “stop” button when error rates of automated systems go beyond a few percent.
It’s straightforward to estimate error rates for an AI scheme. Experts do this by running simulations inside a virtual model called a “digital twin”. These can be used to carry out statistical evaluations, and expose conscious and unconscious biases in bad algorithms.
In Robodebt’s case, a digital twin could have been used to figure out error rates. This would have required running the Robodebt algorithm through representative incomes simulated under two different scenarios.
Under the first scenario, incomes are simulated assuming no debt is owed by anyone. Every time a result is returned saying a debt is owed, a Type 1 (or false-positive) error is recorded. Under the second scenario, incomes are simulated assuming everyone owes a debt (to varying degrees). If a no-debt result is returned, a Type 2 (false-negative) error rate is recorded.
Then an error rate is estimated by dividing the number of errors by the number of simulations, within each scenario.
Eye-watering inaccuracies
Although no consistently reliable error rates have been published for Robodebt, a figure of at least 27% was quoted in Parliament Question Time on February 7.
The reality was probably much worse. During the scheme, on the order of one million income reviews were performed, of which 81% led to a debt being raised.
Of these, about 70% (roughly 567,000 debts) were raised through the use of income averaging in the Robodebt algorithm.
In 2020, the government conceded about 470,000 debts had been falsely raised, out of a total of about 567,000.
Back-of-the-envelope calculations give a Type 1 (false-positive) error rate on the order of 80% (470,000/567,000). Compared to the usual target of a few percent, this is an eye-wateringly large error rate.
If simulations had been run, or human intelligence used to check real cases, the “stop” button would have been hit almost immediately.
Jensen’s inequality establishes why and when income averaging will fail, yet income matching hasn’t gone away. It can be found in AI software used for official statistics, welfare programs, bank loans and so forth.
Deeper statistical theory for this “change of support” problem — for example, going from data on yearly support to fortnightly support — will be needed as AI becomes increasingly pervasive in essential parts of society.
Read more: Why robodebt's use of 'income averaging' lacked basic common sense
Noel Cressie does not work for, consult, own shares in or receive funding from any company or organization that would benefit from this article, and has disclosed no relevant affiliations beyond their academic appointment.
This article was originally published on The Conversation. Read the original article.