Semiconductor giant Texas Instruments Inc (NASDAQ:TXN) ranked among Thursday's top trending securities, though for less-than-desirable reasons. Due to concerns potentially tied to President Donald Trump's tariffs, investors quickly rushed for the exits, sending TXN stock down about 4% in late-afternoon trading. Still, the volatility presents a possible opening for bullish speculators as TXN has reliably bounced back from prior stains of red ink.
According to Reuters, Texas Instruments' finance chief Rafael Lizardi remarked during a Citi Global TMT Conference that robust demand from January to April stemmed partly from tariff-induced market dynamics. Essentially, some customers ordered early to jump ahead of Trump's Liberation Day trade policy.
Unfortunately, Lizardi stated that since April, business either slowed down or at best, didn't expand as it would be expected to. Subsequently, investors read between the lines and trimmed exposure to TXN stock.
Adding to the misery for longtime stakeholders, Texas Instruments has been caught in the wake of a broader tech sector selloff. Perhaps most notably, Nvidia Corp (NASDAQ:NVDA) has suffered an unusual bout of weakness. In the trailing month, NVDA stock has slipped more than 5%. Despite delivering another blockbuster earnings report, Wall Street took a dim view of the company's somewhat soft forward guidance.
Stated differently, merely being an important cog in the artificial intelligence machinery isn't always enough to attract investor dollars. After a strong run in tech, many have decided to take some profits off the table — presenting an empirically backed opportunity for bullish contrarians.
Using Statistical Validation To Identify Upside For TXN Stock
Strip away the magnitude component of TXN's price action and you're left with a seemingly unremarkable market breadth profile. In the trailing 10 weeks, TXN has printed five up weeks and five down weeks, yielding an overall downward trajectory across the period. For simple classification, this sequence can be labeled 5-5-D.
What's interesting about TXN stock is that naturally, it features a positive drift. Over the next 10 weeks, assuming no special mispricing, you would expect TXN to drift between an aggregate low of $192.59 to an aggregate high of $197.25. This could be considered the baseline skew.
However, following the 5-5-D sequence, the conditional skew tilts upward, between a median low of $194.32 to a median high of $199.37. Admittedly, at this point, this is generally when my analysis would stop.
But the problem here is that my claim (that the 5-5-D sequence yields a positive skew) and the evidence to support my claim (the conditional skew being higher than the baseline skew) come from the same dataset (TXN's price action between January 2019 through July 2025). This would be an example of an in-sample argument and is by logical necessity a self-referential assertion.
To better determine a probability of causality — as opposed to a mere observation of correlation — we must apply out-of-sample testing. In other words, it is critical to control for outside factors. Otherwise, we would have zero idea whether our trading strategy actually works or is merely a benefactor of coincidence.
Applying the 5-5-D sequence across multiple time periods and sentiment regimes, it has consistently yielded a positive skew — and noticeably higher than what would be expected from the baseline skew. This was especially true for the entire 2010s decade:
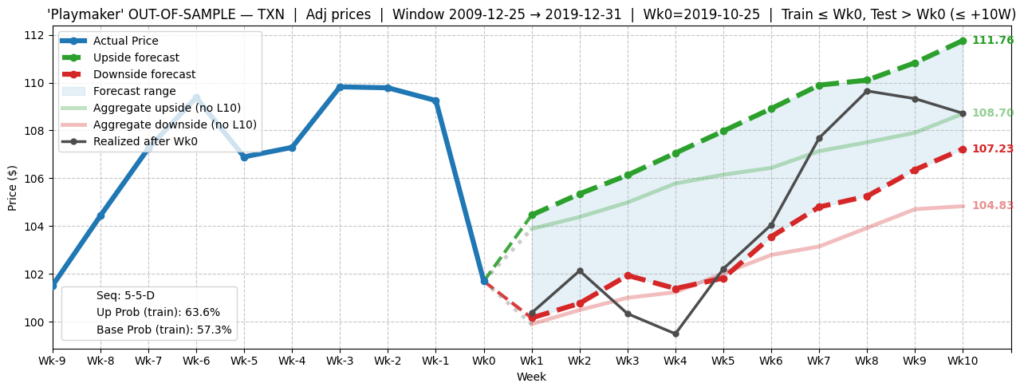
However, the only exception was the post-pandemic period from 2022 through 2024, where the skew's direction was flat but the totality of potential price points expanded significantly (and unpredictably). Drilling into the details, 2023 turned out to be an oddball, where the 5-5-D sequence usually spelled a downtrend over the next 10 weeks.
Other than that, the sequence has been a reliable contrarian signal. As such, TXN stock is worth serious consideration.
A Tempting Deal On The Table
Based on the market intelligence above, the trade that arguably makes the most sense is the 190/195 bull call spread expiring Oct. 17. This transaction involves buying the $190 call and simultaneously selling the $195 call, for a net debit paid of $230 (the most that can be lost in the trade). Should TXN stock rise through the short strike price ($195) at expiration, the maximum profit is $270, a payout of over 117%.
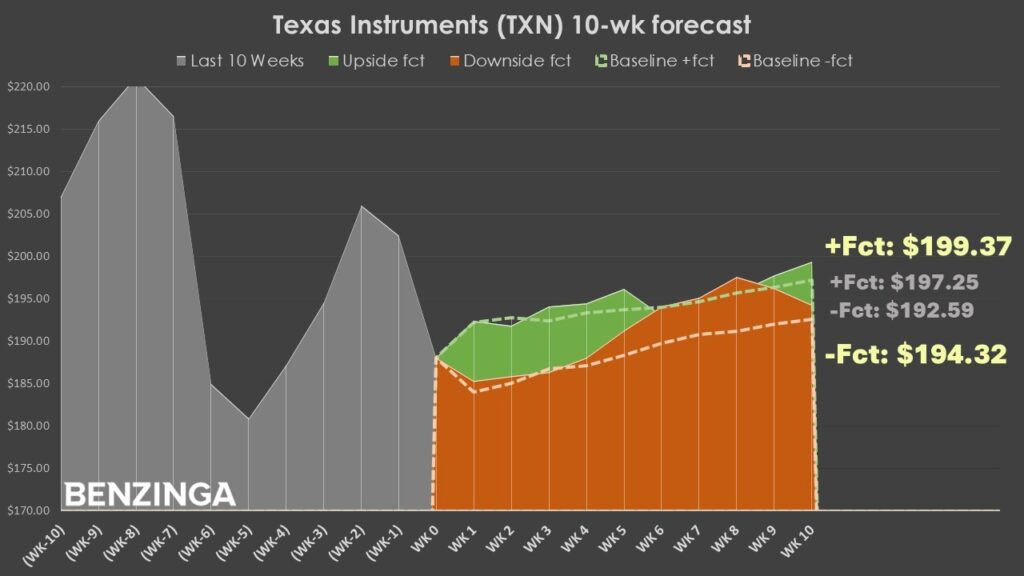
At the $195 price target on Oct. 17, this level aligns with the top end of the baseline skew, as well as the overall conditional skew. Statistically, I have confidence in the above setup because the 5-5-D sequence has reliably signaled upside in multiple sentiment regimes. So, unless there's something unusual about the current regime, the odds likely favor the optimists.
That's not to say that there isn't any risk involved because there clearly is. Because the market is an open and entropic system, anything can happen. Still, because of our out-of-sample testing, we have more confidence that we're pursuing a signal related to causality rather than mere correlation or coincidence.
The opinions and views expressed in this content are those of the individual author and do not necessarily reflect the views of Benzinga. Benzinga is not responsible for the accuracy or reliability of any information provided herein. This content is for informational purposes only and should not be misconstrued as investment advice or a recommendation to buy or sell any security. Readers are asked not to rely on the opinions or information herein, and encouraged to do their own due diligence before making investing decisions.
Read More:
Image: Shutterstock