While the electric vehicles under the Tesla Inc (NASDAQ:TSLA) brand are known for their blistering pace, the same cannot be said for its equity shares at the moment. As with other innovators, TSLA stock has been caught in the broader tech selloff that began on Tuesday. Further, mixed signals from the consumer retail market have weighed on sentiment. Still, the technical and especially statistical backdrop suggests that the EV maker is worth a closer look.
On Wednesday afternoon, TSLA stock dropped around 2.5%, with the security caught in the wake of major tech giants suffering significant volatility. Perhaps the most conspicuous example is big data analytics specialist Palantir Technologies Inc (NASDAQ:PLTR). In the trailing five sessions, PLTR stock gave up around 15.5%, likely a victim of profit-securing motivations following a remarkable rally.
Of course, one of the biggest concerns about PLTR was its sky-high premium. Therefore, it wasn't particularly surprising when Citron's Andrew Left — a noted short seller — initiated a bearish position against Palantir.
However, it probably isn't tech alone that's affecting TSLA stock. In early trading of the midweek session, shares of big-box retailer Target Corp (NYSE:TGT) plunged. On paper, the company delivered the goods for the second quarter, with earnings per share of $2.05 and revenue of $25.21 billion beating their respective consensus estimates. However, TGT stock cratered, likely due to sales and traffic contraction across its stores and website.
Still, TSLA stock may be in an ideal position relative to other tech players because it has incurred a rough outing in 2025 so far, down about 20%. Put another way, investors may not feel compelled to take profits. But that might not necessarily mean that TSLA is a downbeat prospect. From a technical standpoint, one could make the argument it's charting a bullish pennant formation.
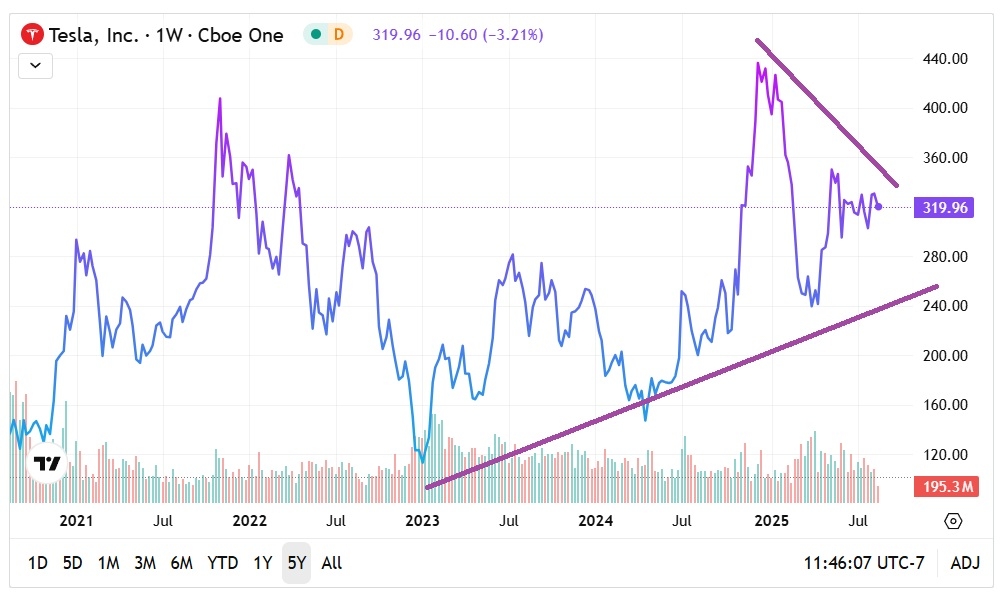
Admittedly, this chart pattern is interpretive so it's not the empirically strongest argument available. Fortunately, there's another line of reasoning that supports the bullish case for Tesla stock.
Identifying The Market's Intentions Regarding TSLA Stock
Those who are interested in holding onto TSLA stock for the long term enjoy a straightforward process: simply buy the security in the open market at a perceived attractive price. For short-term traders — especially those who rely on options — the assignment is much more difficult. Since options expire, the risk profile is multidimensional, with the speculator needing accuracy in both direction and time.
Typically, retail traders often use volatility-dependent analytics to guide their decision-making process. Such methodologies are derived from or influenced by the Black-Scholes formula. Essentially, the idea is that a security features a baseline volatility level. But as anticipated exogenous factors creep up over the horizon (such as an earnings report), volatility "accelerants" are baked into the baseline.
It's a mathematically elegant way of assessing equities. However, the Black-Scholes formula models for a reality (i.e. log-normal distributions) that simply doesn't exist in real-world trading. So, quite a few traders find the approach to be functionally useless.
An arguably more sensible approach is path dependency. By analyzing how a security moves based on specific conditions, users can map out what is likely to happen (via the extrapolation of past analogs). But because share prices often change scales, it's practically impossible to create path-dependent analytics. That's why discretization — or the compression of price action into binary up/down sessions — is a critical step in equity-focused path dependencies.
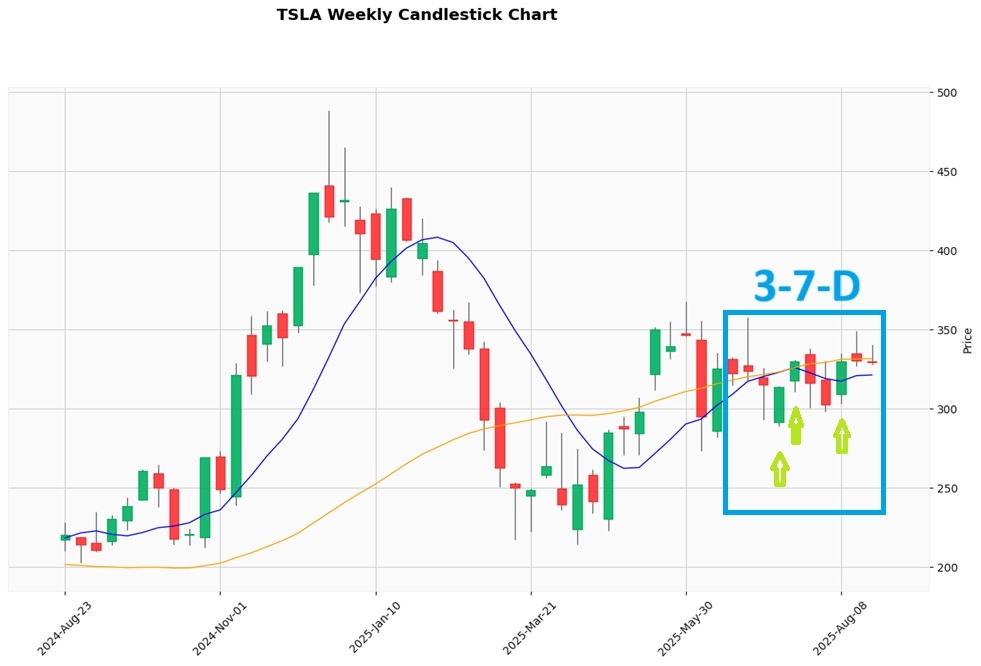
For TSLA stock, the bullish signal stems from the balance of demand. In the trailing 10 weeks, the market essentially voted to buy shares three times and sell seven times. During this period, TSLA incurred a downward trajectory. For brevity, the sequence can be labeled 3-7-D.
Since January 2019, this sequence has flashed 33 times on a rolling basis. In 60.61% of cases, the following week's price action results in upside, with a median return of 7.69%. As a baseline, the chance that a long position in TSLA stock will be profitable is 52.45%. Assuming that the implications of the 3-7-D hold up, there's a clear empirical incentive to pursue a debit-based strategy.
Taking Advantage Of Market Jitters
With the benchmark Nasdaq Composite in a downtrend over the trailing five sessions, market makers are understandably nervous. They've got to cover for the possibility of continued red ink, which means that they're going to sweeten the pot for the bullish side of the trade. These folks are likely using volatility-dependent analytics to arrive at their conclusions. However, path dependency opens the door to other possibilities.
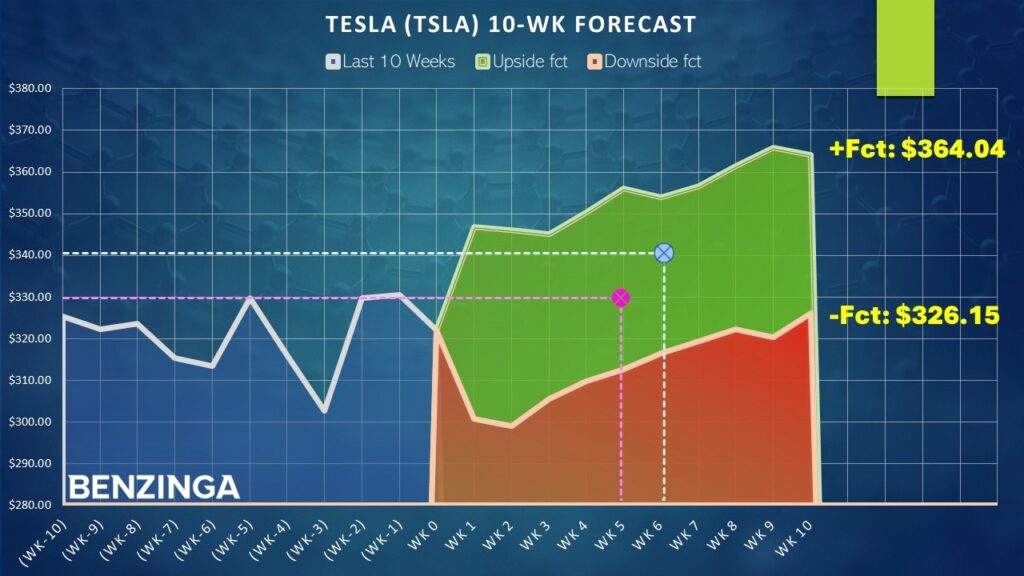
One of those possibilities is the $327.50/330.00 bull call spread expiring Sept. 19. This transaction involves buying the $327.50 call and simultaneously selling the $330 call, for a net debit paid of $120 (the most that can be lost in the trade). Should TSLA stock rise through the short strike price ($330) at expiration, the maximum profit is $130, a payout of over 108%.
What makes the above trade attractive is that the $330 target is closer to the negative pathway. Theoretically, assuming that the 3-7-D sequence plays out as expected, this tight delta to the negative pathway offers a margin of safety, at the risk of incurring an opportunity cost. For those who want greater reward potential, the 335/340 bull spread expiring Sept. 26 could be attractive. Here, the max payout stands at over 163%.
Either way, a lot rides on the viability of the 3-7-D sequence. Running a one-tailed binomial test reveals a p-value of 0.2231, which indicates that there's a 22.31% chance that the implications of the signal could materialize randomly as opposed to intentionally.
To be fair, that's a little bit higher than I normally would like. However, when it comes to beaten-down tech stocks that could be primed for a reversal, TSLA is well worth consideration.
The opinions and views expressed in this content are those of the individual author and do not necessarily reflect the views of Benzinga. Benzinga is not responsible for the accuracy or reliability of any information provided herein. This content is for informational purposes only and should not be misconstrued as investment advice or a recommendation to buy or sell any security. Readers are asked not to rely on the opinions or information herein, and encouraged to do their own due diligence before making investing decisions.
Read More:
Image: Shutterstock