
As a rule of thumb, exceeding financial estimates usually generates investor excitement. Unfortunately, that wasn't the case for software developer GitLab, Inc. (NASDAQ:GTLB). For the first quarter of fiscal 2026, GitLab posted earnings per share of 17 cents, beating the consensus view of 15 cents. Further, revenue landed at $214.51 million, beating estimates calling for $213.16 million. Still, GTLB stock slipped hard after the results, which were disclosed in June.
Unfortunately, investors took a dim view of the updated guidance for the second quarter. Although GitLab sees adjusted second-quarter EPS landing between 16 cents and 17 cents (compared to the 16-cent estimate), management revealed that revenue may land between $226 million and $227 million. This range conspicuously dipped below Wall Street's expectation of $227.16 million.
Still, the leadership team emphasized the value of its core business. GitLab specializes in a field known as DevSecOps, a combination of development, security and operations. Specifically, the company simplifies software delivery by combining hosting, CI/CD (continuous integration and continuous deployment), security and project management into one seamless platform. Further, GitLab integrates artificial intelligence into this platform, enhancing productivity and security.
"First quarter fiscal year 2026 results underscore the power of our AI-native DevSecOps platform to help customers deliver mission-critical software. We're giving every developer the AI-driven edge they need to innovate faster and more efficiently," said Bill Staples, GitLab CEO.
It's also worth pointing out that, despite last month's volatility in GTLB stock, Wall Street analysts still anticipate robust capital gains. True, several experts — while maintaining their assessments of the company — lowered their price forecasts. Still, even some of the more modest targets imply about a 15% lift from current prices.
Leveraging Applied Game Theory To Decipher A Strategy For GTLB Stock
Although fundamental narratives provide important color and context, they lack specificity. The brutal truth is that no one really cares what anyone thinks about a particular news item. Ultimately, the only thing that matters is whether investors as a collective whole decided to buy the security in question or not. That's why, in the past few months, I've been focused on market breadth or sequences of accumulative and distributive sessions.
As I mentioned in yesterday's Options Corner column featuring Micron Technology Inc (NASDAQ:MU), blackjack strategies — namely card counting — provide an insightful mechanism for forecasting potential stock price movements. Card counting falls under the broad category of applied game theory, which is essentially the strategic use of probabilities to make decisions in competitive environments where outcomes depend on both uncertainty and the actions of others.
Professional blackjack players keep a running count of the cards that have been dealt according to a system that separates individual cards into three categories: negative value, neutral value, positive value. In short, the idea is to bet big when the odds favor the player and to bet small when the odds favor the dealer.
However, in order to empirically justify the larger wager, the player must calculate two types of probabilities: derivative and conditional. The former establishes the baseline odds for the player, also known as the Gaussian framework. The latter is tied to a Markovian framework, which represents the odds tied to a specific hand or circumstance.
Now, it's possible to transfer card-counting strategies to provide a forecast for GTLB stock or any other security. However, a common approach — as was demonstrated by this research paper from the KTH Royal Institute of Technology — is to focus on price or its derivatives. In my opinion, this approach creates distortions and does not stay true to core Markovian principles.
Instead, the focus should be on discrete states, which is where market breadth comes in. As a representation of demand, market breadth is effectively binary. Subsequently, it's easier to identify distinct behavioral states, and more importantly, the likelihood of one state transitioning to another.
Regarding GTLB stock, it is currently printing a "3-7-D" sequence: three up weeks, seven down weeks, with a negative trajectory across the 10-week period. Admittedly, converting price action into market breadth compresses GTLB's magnitude dynamism into a simple binary code. But the benefit is that demand profiles can be categorized and quantified, laying the foundation for conditional probabilistic analysis.
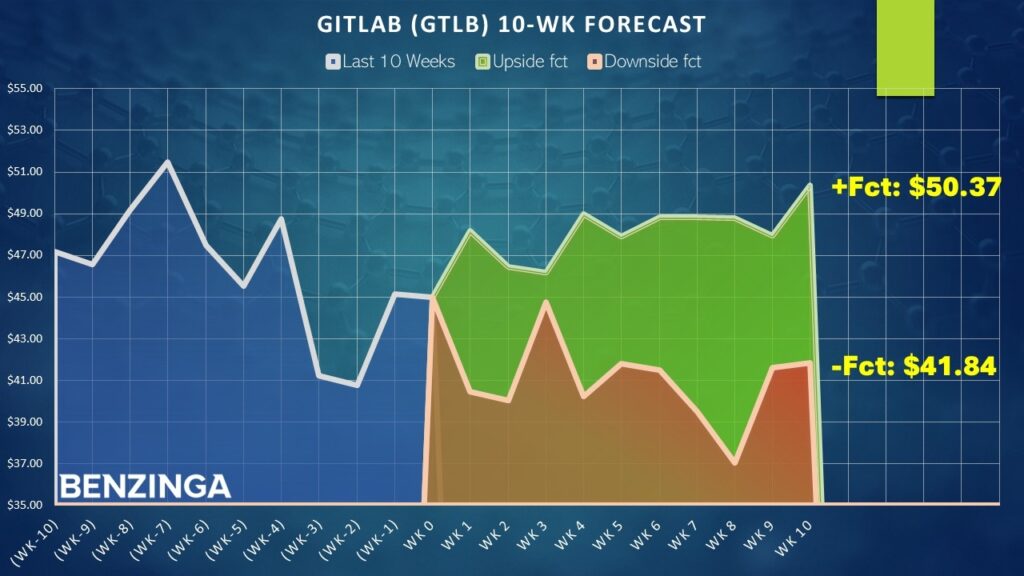
Notably, the 3-7-D sequence has flashed 21 times since January 2019. In 61.9% of cases, the price action for the following week (which corresponds to the business week beginning July 7) results in upside, with a median return of 7.04%.
Assuming that GTLB closes this week at $45, it could potentially rise to above $48 quickly (within a week or two).
A Tempting Offer On The Table
Given the market intelligence above, arguably the most tempting offer on the table is the 45/47 bull call spread expiring July 25. This transaction involves buying the $45 call and simultaneously selling the $47 call, for a net debit paid of $90 (the most that can be lost in the trade). Should GTLB stock rise through the short strike price ($47) at expiration, the maximum reward is $110, a payout of over 122%.
Primarily, this trade is attractive because of the implied shift in sentiment regime. Ordinarily, GTLB stock suffers from a negative bias. As a baseline, the chance that it will rise on any given week is only 48.21%. However, the distribution-heavy 3-7-D sequence statistically inspires buy-the-dip sentiments. Therefore, while the Gaussian hand may be lousy, the Markovian hand is compelling.
To be clear, the stock market is an open system, meaning that outside influencers can enter the paradigm and disrupt it. The best models in the world cannot account for the infinite variables that open systems can impose. That said, using applied game theory under an authentic Markovian framework can help empirically guide your trading ideas.
The opinions and views expressed in this content are those of the individual author and do not necessarily reflect the views of Benzinga. Benzinga is not responsible for the accuracy or reliability of any information provided herein. This content is for informational purposes only and should not be misconstrued as investment advice or a recommendation to buy or sell any security. Readers are asked not to rely on the opinions or information herein, and encouraged to do their own due diligence before making investing decisions.
Read Next:
Photo: Shutterstock