

Earnings season ramps up this week with some key tech earnings on tap. This week we have Tesla (TSLA), Intel (INTC), Alphabet (GOOGL), GE Verona (GEV), International Business Machines (IBM), ServiceNow (NOW), Freeport-Mcmoran (FCX) and American Express (AXP) all reporting in what shapes as a busy and pivotal week for stocks.
Before a company reports earnings, implied volatility is usually high because the market is unsure about the outcome of the report. Speculators and hedgers create huge demand for the company’s options which increases the implied volatility, and therefore, the price of options.
After the earnings announcement, implied volatility usually drops back down to normal levels.
Let’s take a look at the expected range for these stocks. To calculate the expected range, look up the option chain and add together the price of the at-the-money put option and the at-the-money call option. Use the first expiry date after the earnings date. While this approach is not as accurate as a detailed calculation, it does serve as a reasonably accurate estimate.
Monday
Nothing of note
Tuesday
COF – 5.5%
GM – 6.7%
SCHW – 4.7%
MMM – 5.8%
Wednesday
TSLA – 7.0%
GOOGL – 6.6%
IBM – 6.8%
NOW – 12.5%
T – 5.0%
TXN – 10.5%
GEV – 8.6%
CSX – 4.6%
Thursday
INTC – 14.9%
FCX – 7.2%
NEM – 6.6%
BX – 5.6%
RTX – 5.3%
LMT – 5.4%
Friday
VZ – 4.6%
SLB – 4.7%
AXP – 4.6%
NEE – 3.8%
Option traders can use these expected moves to structure trades. Bearish traders can look at selling bear call spreads outside the expected range.
Bullish traders can sell bull put spreads outside the expected range, or look at naked puts for those with a higher risk tolerance.
Neutral traders can look at iron condors. When trading iron condors over earnings, it is best to keep the short strikes outside the expected range.
When trading options over earnings, it is best to stick to risk defined strategies and keep position size small. If the stock makes a larger than expected move and the trade suffers a full loss, it should not have more than a 1-3% effect on your portfolio.
Stocks With High Implied Volatility
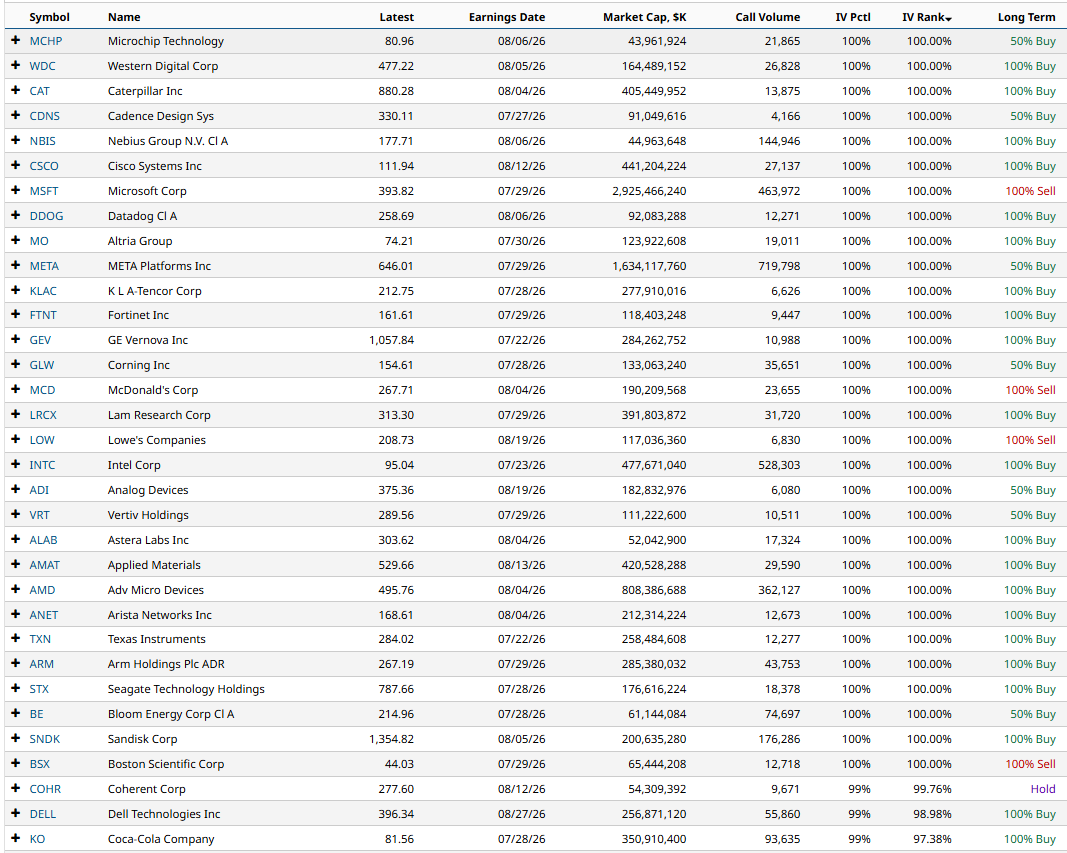
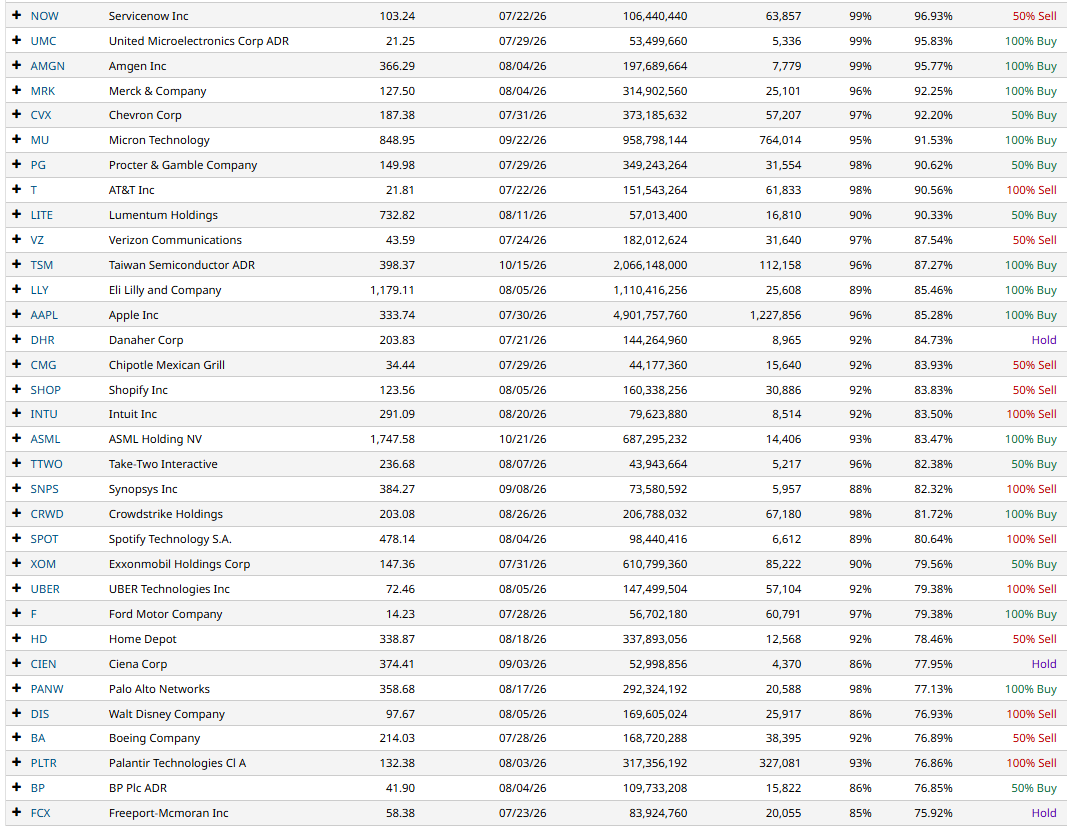
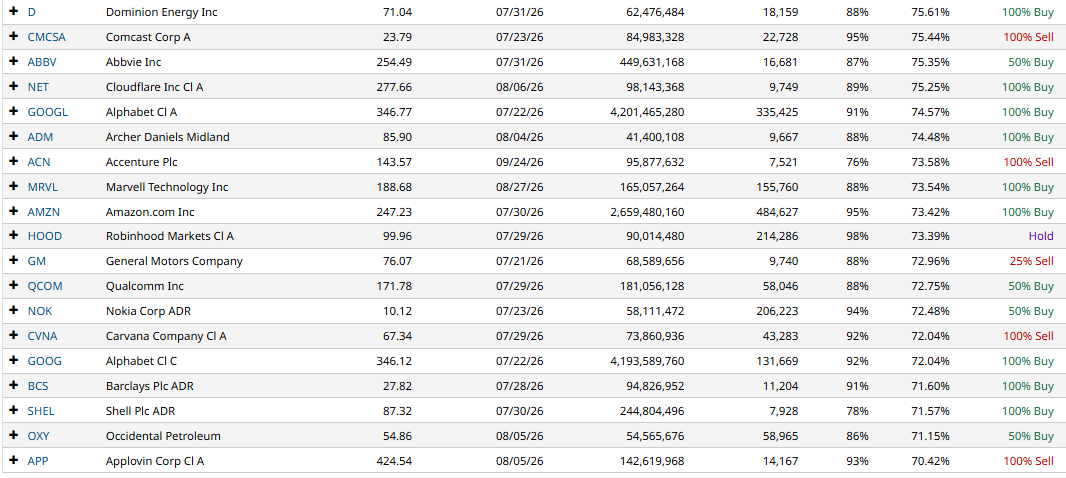
We can use Barchart’s Stock Screener to find other stocks with high implied volatility.
Let’s run the stock screener with the following filters:
- Total options volume: Greater than 10,000
- Market Cap: Greater than 40 billion
- IV Rank: Greater than 70%
This screener produces the following results sorted by IV Rank.
You can refer to this article for details of how to find option trades for this earnings season.
Last Week’s Earnings Moves
BAC +1.9% vs 3.6% expected
C -5.3% vs 4.5% expected
WFC -2.7% vs 5.1% expected
GS +9.0% vs 4.7% expected
JPM +2.5% vs 3.7% expected
JNJ -2.7% vs 3.8% expected
UAL -1.8% vs 7.0% expected
ASML +2.2% vs 8.4% expected
MS +0.4% vs 4.9% expected
TSM -2.3% vs 6.5% expected
NFLX -7.3% vs 7.8% expected
UNH +1.2% vs 6.3% expected
GE -4.1% vs 5.4% expected
Overall, there were 11 out of 13 that stayed within the expected range. 6 out of 13 moved higher following their announcement.
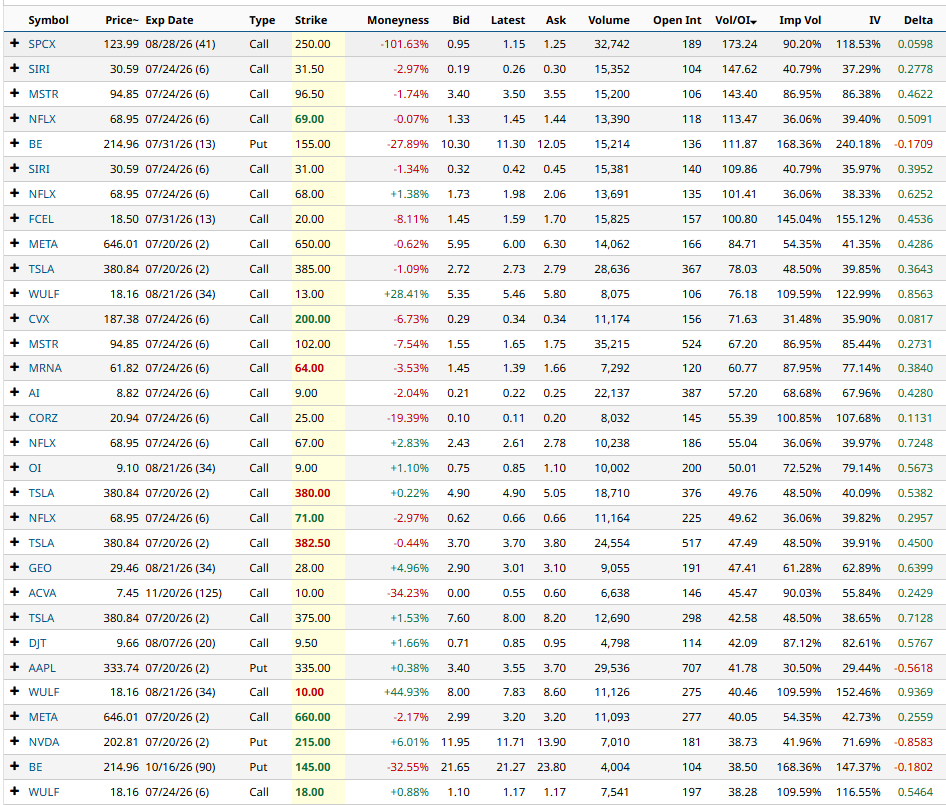
Unusual Options Activity
SPCX, MSTR, NFLX, META and TSLA all experienced unusual options activity last week.
Other stocks with unusual options activity are shown below:
Please remember that options are risky, and investors can lose 100% of their investment. This article is for education purposes only and not a trade recommendation. Remember to always do your own due diligence and consult your financial advisor before making any investment decisions.