Sure, On Holdings (ON) technically ranks among publicly traded securities recently flashing unusual options activity. However, it’s the lull that has raised eyebrows.
Following last Friday’s close, ON stock options volume sat at 10,645 contracts, represent a 32.14% decline against the one-month trailing average. Further, the breakdown didn’t seem particularly enticing, with call volume reaching 6,278 contracts versus put volume of 4,367 contracts.
Looking into options flow — which focuses exclusively on big block transactions — revealed that net trade sentiment slipped to $208,900 below parity on Friday, thus favoring the bears. Most of the calls were on that day were sold, meaning that traders were underwriting the risk that ON stock would not rise.
No one can truly read minds and therefore understand the honest-to-goodness intention of these transactions. Still, institutional traders selling more calls than buying isn’t exactly the most confidence-inspiring signal.
Adding to the skepticism is the poor technical picture. According to the Barchart Technical Opinion indicator, ONON stock represents a 100% Strong Sell. It’s particularly in danger of falling deeper into its current bearish trend.
Still, it’s not all bad news. Wall Street analysts rate ONON stock as a consensus Strong Buy, with only one expert labeling the equity as a Sell. Overall, analysts are targeting a 12-month mean price forecast of $64.41, which would imply a nearly 54% lift from the time of writing.
It raises the obvious question: which side is more accurate?
A Category Hole of Black-Scholes
Typically, traders who want to understand where a specific security may head will utilize the Black-Scholes-Merton (BSM) model to determine a high-low range. However, those who use this approach are effectively committing a category error. BSM is a pricing framework designed to estimate the “fair value” of a forward-looking contract. It’s not a predictive model.
Granted, you could use BSM as a predictive indicator but you would be left with a terrible dilemma: you have no idea what the exceedance ratio is relative to the anchor price.
In other words, within the high-low range of prices that have been spit out for the particular options chain you’re focused on, you don’t know on which side of the starting point — either the profit side or loss side — you’re more likely to end up in.
To answer that question, investors turn to subjective heuristics like technical analysis. But if you’re going to use TA as your ultimate decision-maker, then BSM only serves as a general reference.
Introducing VolaPrint: The Volatility Fingerprint of ON Stock
While BSM does offer some value in establishing what could be the total price picture of the target security, we have no idea where outcomes are more likely to cluster. To get around this problem, we need to understand each individual security’s psychological profile.
Over the weekend, I developed a model called VolaPrint, short for Volatility Fingerprint. It takes the idea of a distributive curve from BSM but rather than assume a lognormal distribution — with the only difference being each stock’s implied volatility (IV) — VolaPrint incorporates a bespoke empirical distribution.
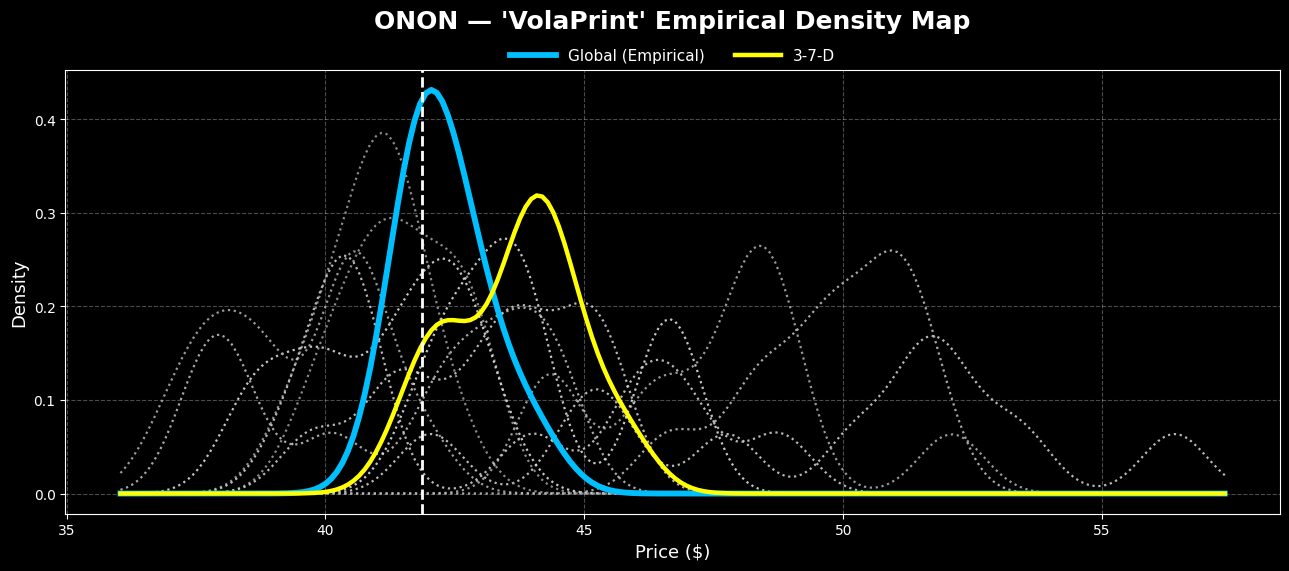
In other words, this latest approach crafts a probabilistic distribution based on the target security’s actual price history. So, while BSM builds a range of what should happen, VolaPrint generates data from what did.
What’s more, this empirical forecasting model juxtaposes the probabilistic expectations of baseline conditions versus the expectations derived from the current sentiment regime. These regimes are built off the sequencing logic that I have been utilizing over the last several months.
At first glance, the complexity may seem daunting but it’s really just a sentiment roadmap. Essentially, every stock has a baseline personality. However, based on circumstances that have happened in the recent past, the probability of what could happen in the future may change.
My solution is to use advanced algorithms to identify the asymmetry between the commonly expected (baseline) outcome and the conditional outcome (sourced by the aforementioned sequencing logic); if such an asymmetry exists and if the odds align with a high hit ratio, then the underlying options strategy may be favorably mispriced.
A Bold Move for the Adventurous
In the last 10 weeks, ONON stock has printed a 3-7-D sequence: three up weeks, seven down weeks, with an overall downward trajectory. This sequence is rare, representing only 9.84% of all identifiable patterns since On Holding’s public market debut. However, the median price of outcomes tied to the 3-7-D tends to rise above the median of all outcomes.
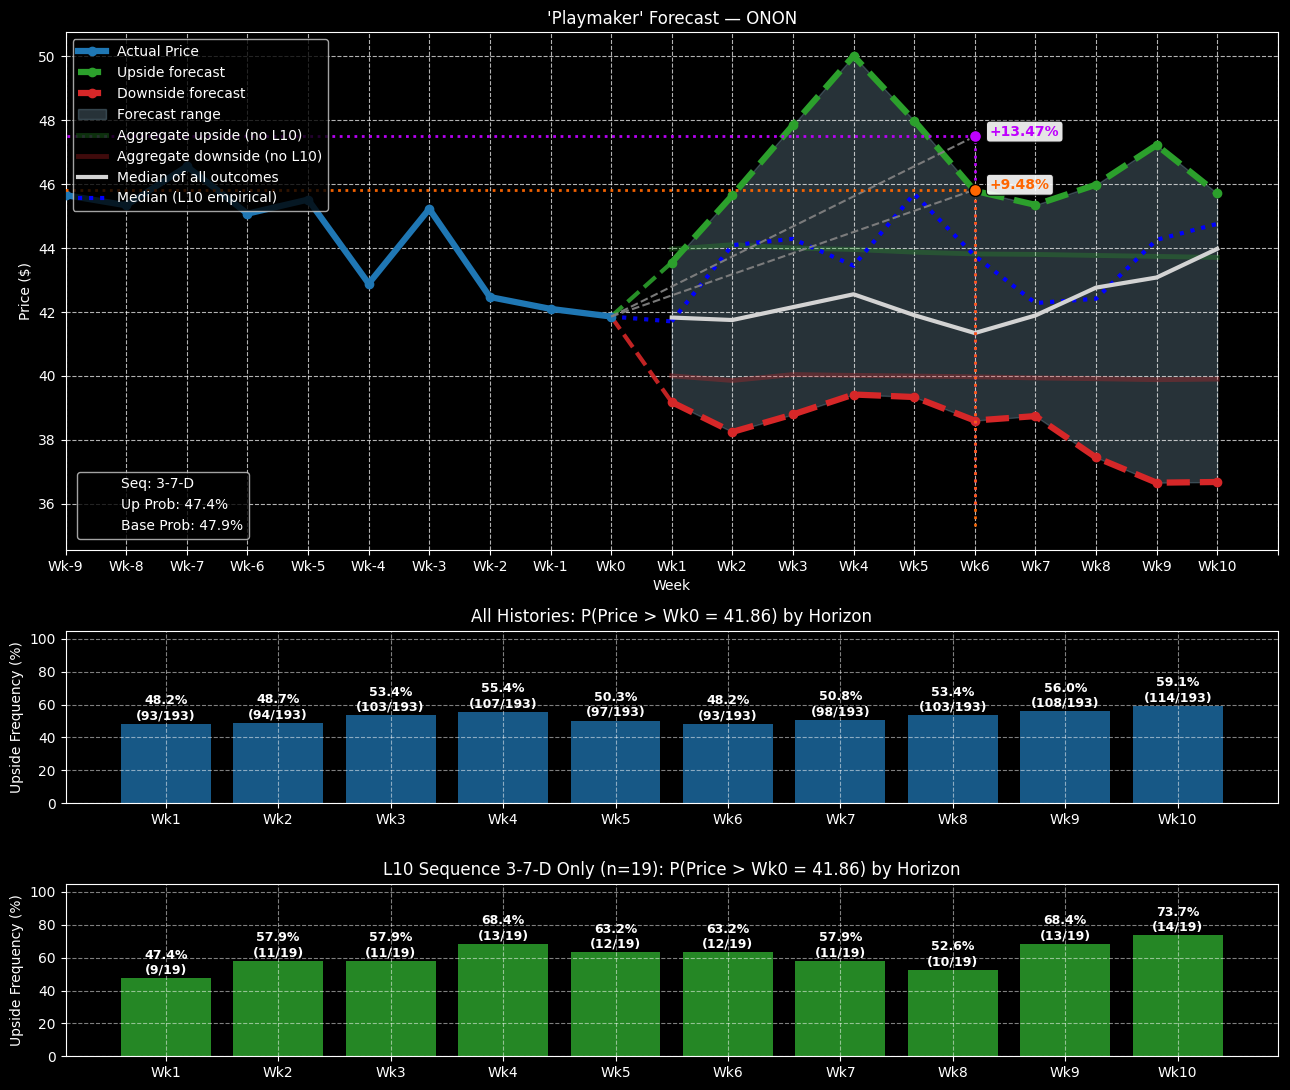
Stated differently, there’s an empirical asymmetry here. It doesn’t mean that you’re guaranteed to witness above-average success ratios. However, the odds based on the available data appear to favor the bulls.
If so, the most aggressive trade that’s arguably within the realm of rationality is the 45.00/47.50 bull call spread expiring Nov. 21. This trade will require ONON stock to rise through the second-leg strike price ($47.50) at expiration, which admittedly is a tall order.
Still, if it happens — and the buy-the-dip sentiments of ONON stock make it possible — the maximum payout clocks in at over 201%.