Micron Technology Inc (NASDAQ:MU) easily ranks among the top-performing equities, gaining over 140% since the start of the year. For context, Advanced Micro Devices Inc (NASDAQ:AMD) — another high-flying enterprise in the advanced semiconductor space — has swung up 97% during the same frame. Ironically, though, such success can also be the source of technical anxiety.
In the trailing six months, MU stock has witnessed 203% lift, which on one hand has naturally delighted stakeholders. At the same time, the temptation to secure some profits is also elevated. For fundamental context, MU currently trades at 5.53 times trailing-year revenue. At the end of May, this metric sat at 3.4 times sales.
Nevertheless, bullish investors will point to Micron's financial performances as evidence for continued viability. For example, in the most recent earnings report for the fiscal fourth quarter, the semiconductor company — which specializes in memory chips — posted adjusted earnings per share of $3.03, beating the consensus view of $2.79. On the top line, Micron generated $11.31 billion, up 1.35% above the $11.16 billion consensus target.
One would have to go back to late March 2023 for the last time Micron missed on both the top and bottom lines. Outside of that quarter and the one immediately preceding it, the chipmaker has generally delivered comprehensive beats, with some of the variances to analysts' targets being quite sizable.
Still, one of the pressing issues for traders is the likelihood of sustained momentum. Using data from January 2019, the projected 10-week median return of MU stock forms a standard distribution, with price clustering expected to occur roughly around $206 (assuming a starting position or anchor price of $202.29).
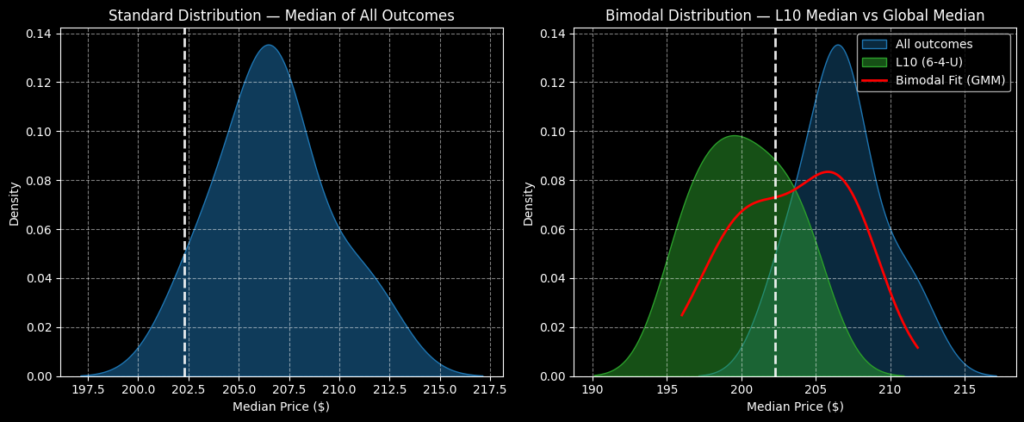
At the moment, MU is coming off a positive-trending 10-week sequence where it printed six up weeks and four down weeks. This particular population group forms a bimodal distribution relative to the parent dataset, indicating a slightly bearish skew. Also, price clustering under this grouping would be expected to cluster around $199 (assuming the same $202.29 anchor).
It's possible, then, that Micron's positive bias in the market could be tilting in the other direction, presenting ideas for inverse-minded traders.
The Direxion ETFs: With market participants on both sides of the sentiment aisle having justification for their thesis, financial services provider Direxion offers a pair of relevant products. For optimistic traders, the Direxion Daily MU Bull 2X Shares (NASDAQ:MUU) tracks 200% of the daily performance of MU stock. For pessimists, the Direxion Daily MU Bear 1X Shares (NASDAQ:MUD) tracks 100% of the inverse performance of the namesake security.
In both cases, the primary selling point is convenience. Usually, traders who are interested in leveraged or inverse positions must engage the options market. However, certain derivative or synthetic strategies carry complexities which may not suit all investors. In contrast, Direxion ETFs are straightforward, debit-based transactions, functioning very much like any other publicly traded security.
Still, familiarity does not mean risk-free. For one thing, leveraged and inverse funds tend to be more volatile than standard vehicles tracking benchmark indices like the Nasdaq Composite. Second, Direxion ETFs carry nuanced risks, with illiquidity being a possible challenge. Finally, keep in mind that these funds are designed for exposure lasting no longer than one day. Going beyond this recommendation exposes one to positional decay due to the daily compounding effect.
The MUU ETF: Since the start of the year, the MUU ETF has gained nearly 285%. In the trailing half-year period, it's up almost 681%.
- An initial assessment appears very positive for MUU, with the bull fund well above its 50- and 200-day moving averages, in addition to the 20-day exponential moving average.
- Accumulative volume, though, is starting to tick down while the price action swings higher, which is not the most favorable correlation.
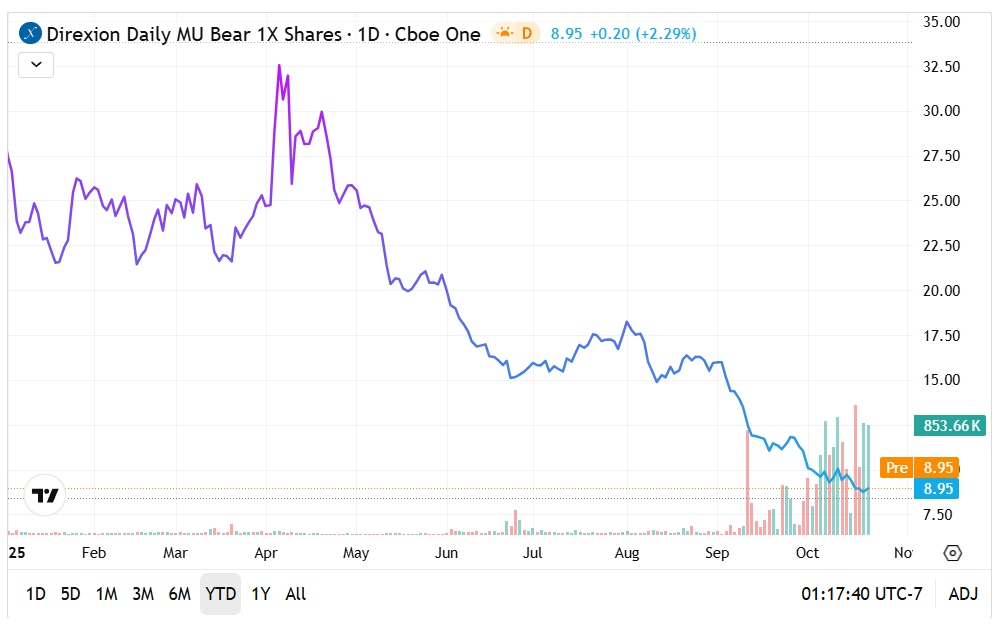
The MUD ETF: Unsurprisingly, the MUD ETF has been a laggard, losing roughly 69% since the beginning of January. However, in recent sessions, inverse traders have been attempting to bid up the fund.
- Against common technical gauges, MUD looks inauspicious, falling steeply below the 50 and 200 DMAs.
- Interestingly, accumulative volume has picked up substantially in recent sessions, which may signal a possible pivot to the inverse position.