Lucid Motors (LCID) is suffering, and we can only imagine investors in LCID stock are begging for lucidity.
As we ask ourselves what’s going on, the first thing we must do is look at the chart. Because no matter what the narratives and valuation might say, when a stock face-plants by a not-cool 50% in about 6 weeks’ time, there’s something more than a bad quarter, inventory backlog, or concerns about excessive valuation. There’s a real problem.
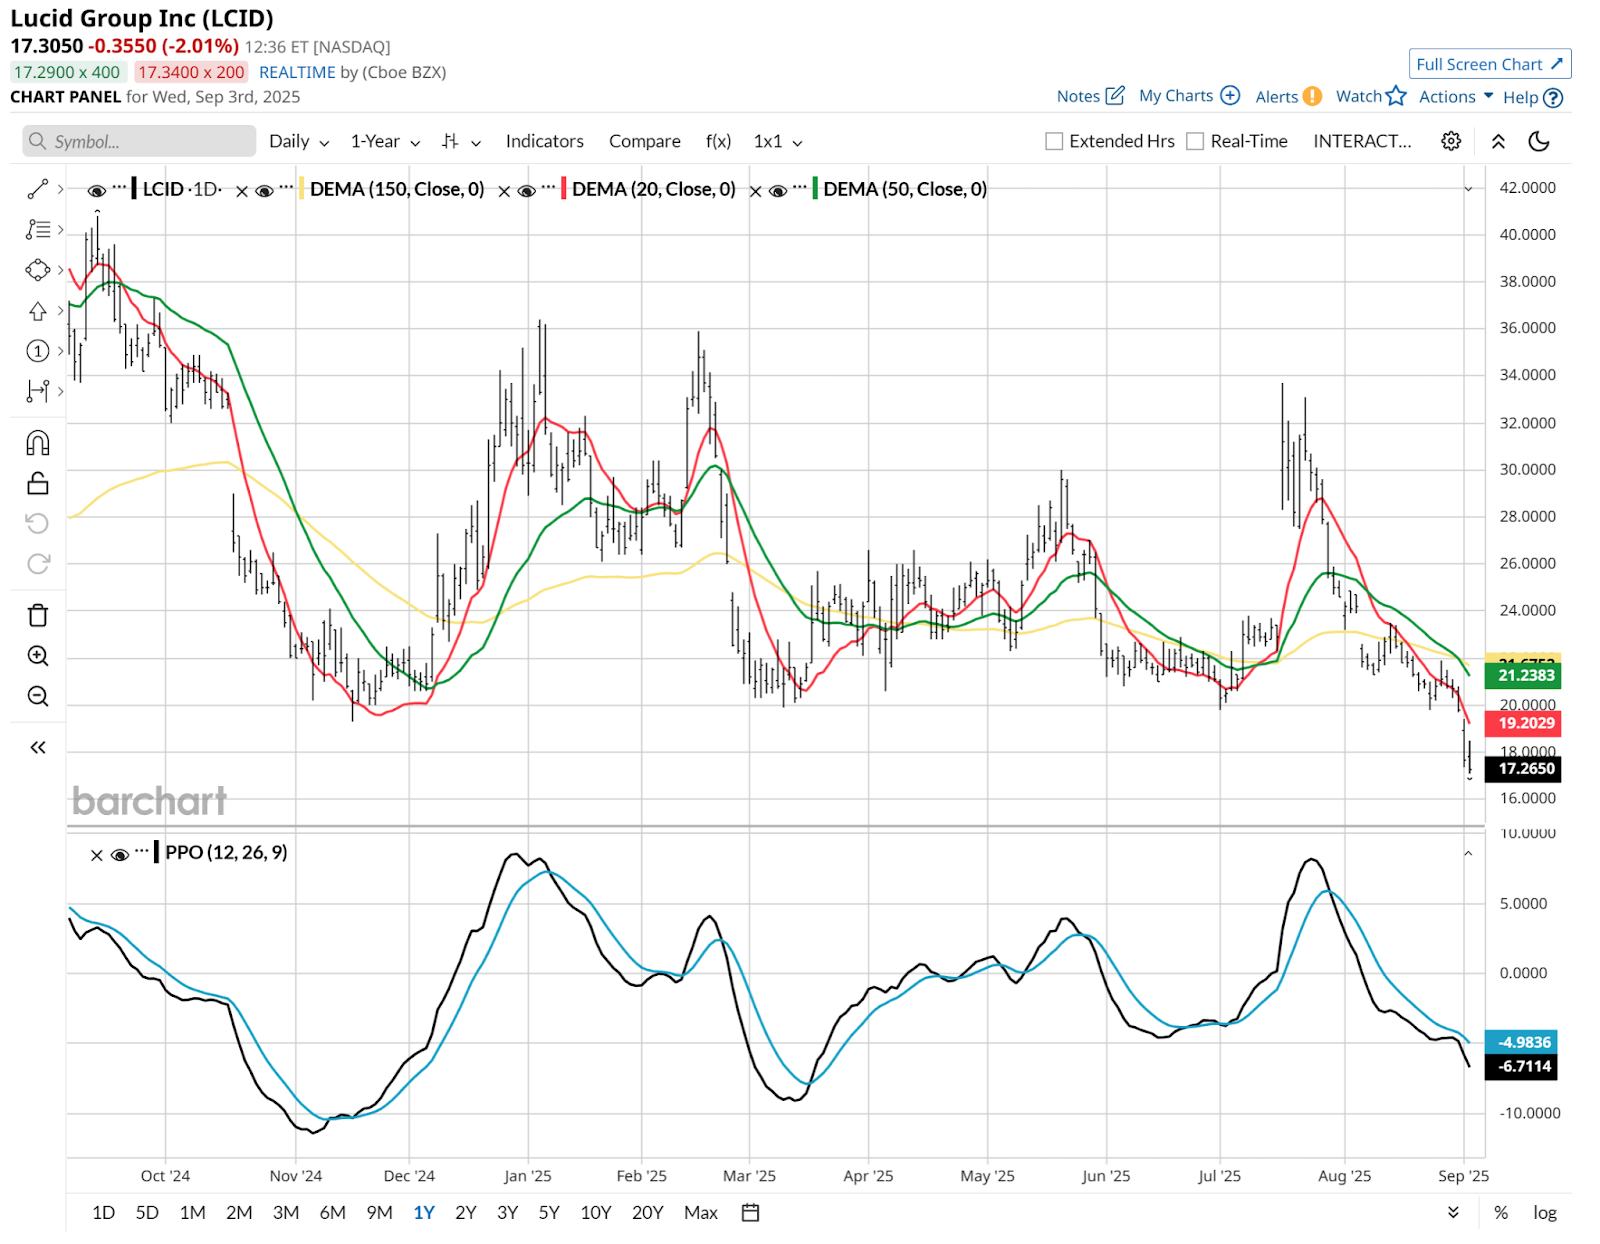
Here’s the daily view, which shows clearly that the stock is in trouble. What would concern me if I were a shareholder is not that the stock is down so much, so quickly. It is that it doesn't look nearly done falling. That’s what the PPO indicator at the bottom of the chart is telling me.
Here’s LCID’s weekly.
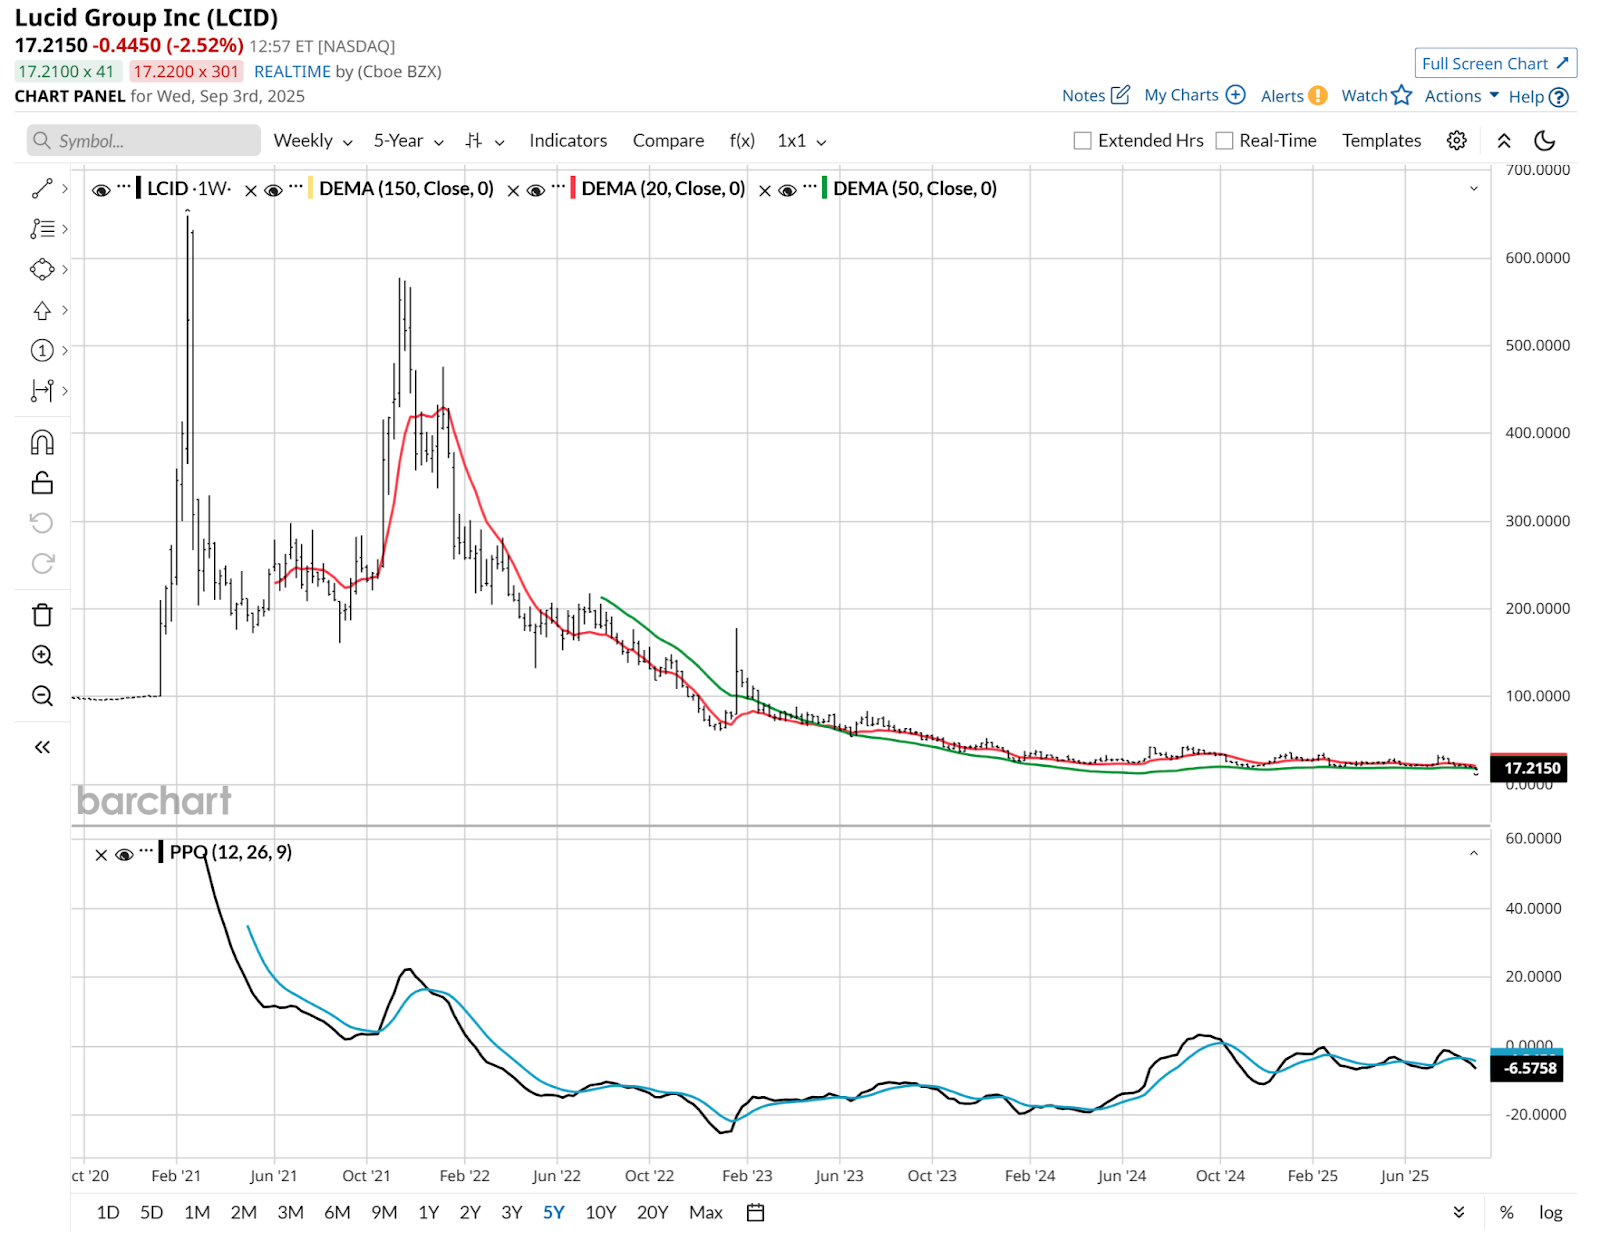
The reason I’m showing this is because this could be what a lot of stocks look like in the AI space at some point in this market cycle. LCID was a hyped stock with legit long-term potential. But that P-word (potential) has to be realized with revenue and especially profits.
Because when we look at the recent news surrounding this California-based electric car maker, we’d need something strong enough to offset the fact that it is still in the “negative earnings” phase (i.e. they lose money), yet the stock was recently worth $10 billion in market capitalization. At $5 billion, it still doesn’t appear to make sense. That’s what the chart tells me.
Some positive “event” is about the only thing that can turn this vehicle around soon. The recent 1-for-10 reverse stock split didn’t do it, it only made it worse. An investment from Uber (UBER) didn’t move the needle either. August’s earnings were the main catalyst, but the bulls need something to cling on to here. Otherwise, they are riding with the door open, hoping they don’t fall out.
Still, with decades of “long-short” investing behind me, I naturally look at every situation the same way: Everything has risk and reward potential. If the balance is strongly in favor of reward (high reward for the risk taken), that’s intriguing. If it’s the reverse, it’s a “longshot.” I’ll play a longshot but not with much capital. That, in essence, is the concept of “position sizing” we talk about here.
Or, we can look to collar it with options. That would allow a trader to place an “uncle” level below which they can’t lose, while likely retaining a lot of upside room for a while. Volatile stocks in either direction are often good collar candidates. Let’s check this one out.
In what is a first for me in my work here, when I clicked on the “Protection Strategies” tab for LCID, no collar combinations came up. That typically signals low liquidity. And since there are many ways to use Barchart’s options tools to craft a collar, I’ll do it the other way, looking at the put purchase and call sale separately.
I always start with the put side, owing to my strong preference for risk management over “look how much I could make.” I’m going out to Jan. 16, 2026, which gets me through one quarterly report in November, and the analyst estimate game that will be played prior to the early February 2026 quarterly report.
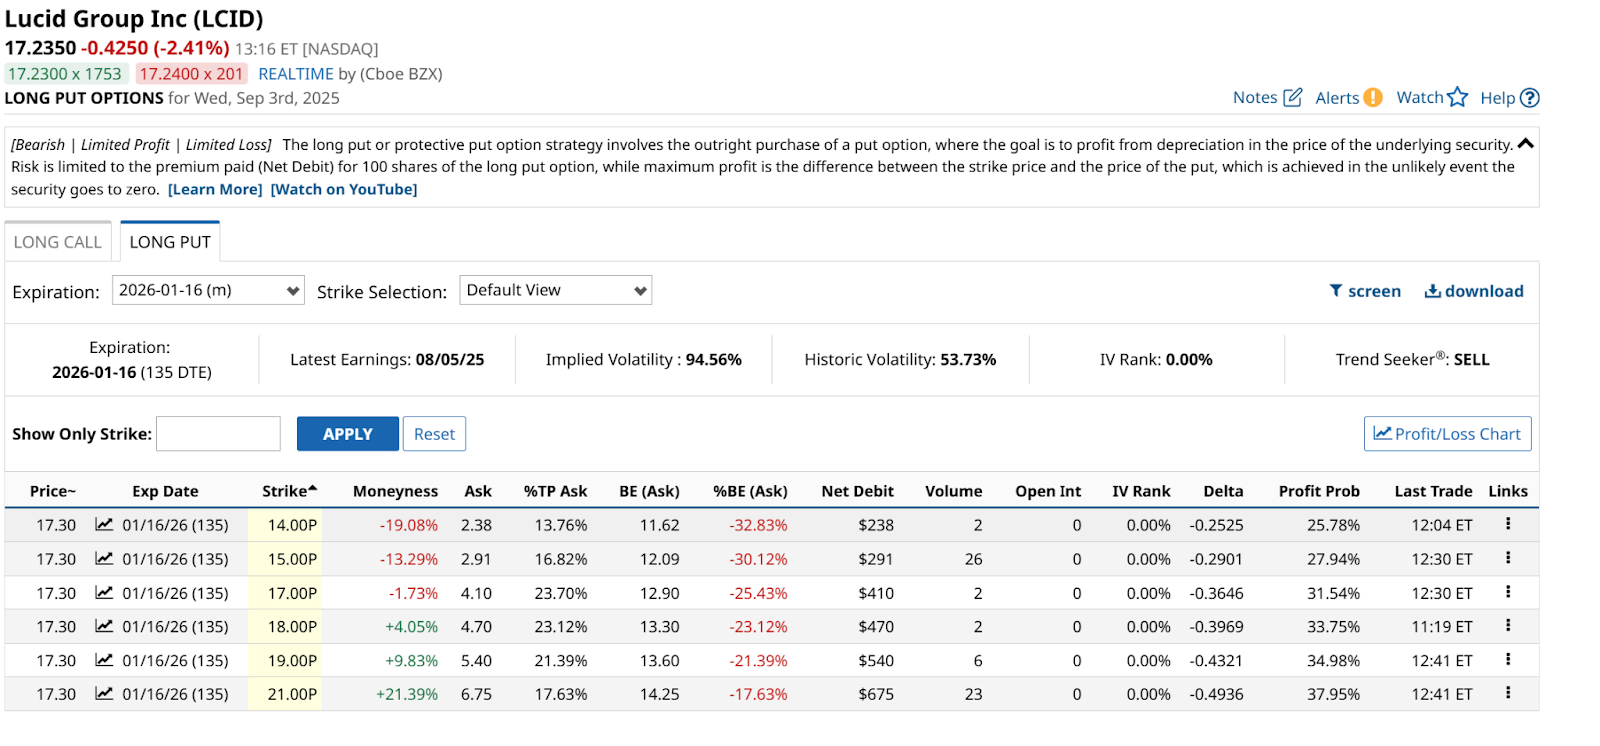
There are a few options to choose from (pun absolutely intended, for educational purposes of course). But I’ll focus on the $17 strike which costs $4.10. Gunslinger investors might allow for a drop to $14 or $15. Not this old man.
That’s a big chunk of change for a $17 stock, but that’s what the other side of the collar is for. I’m going to see how much of that I can fund via a covered call sale, which will cap my upside but buy down the expensive put cost.
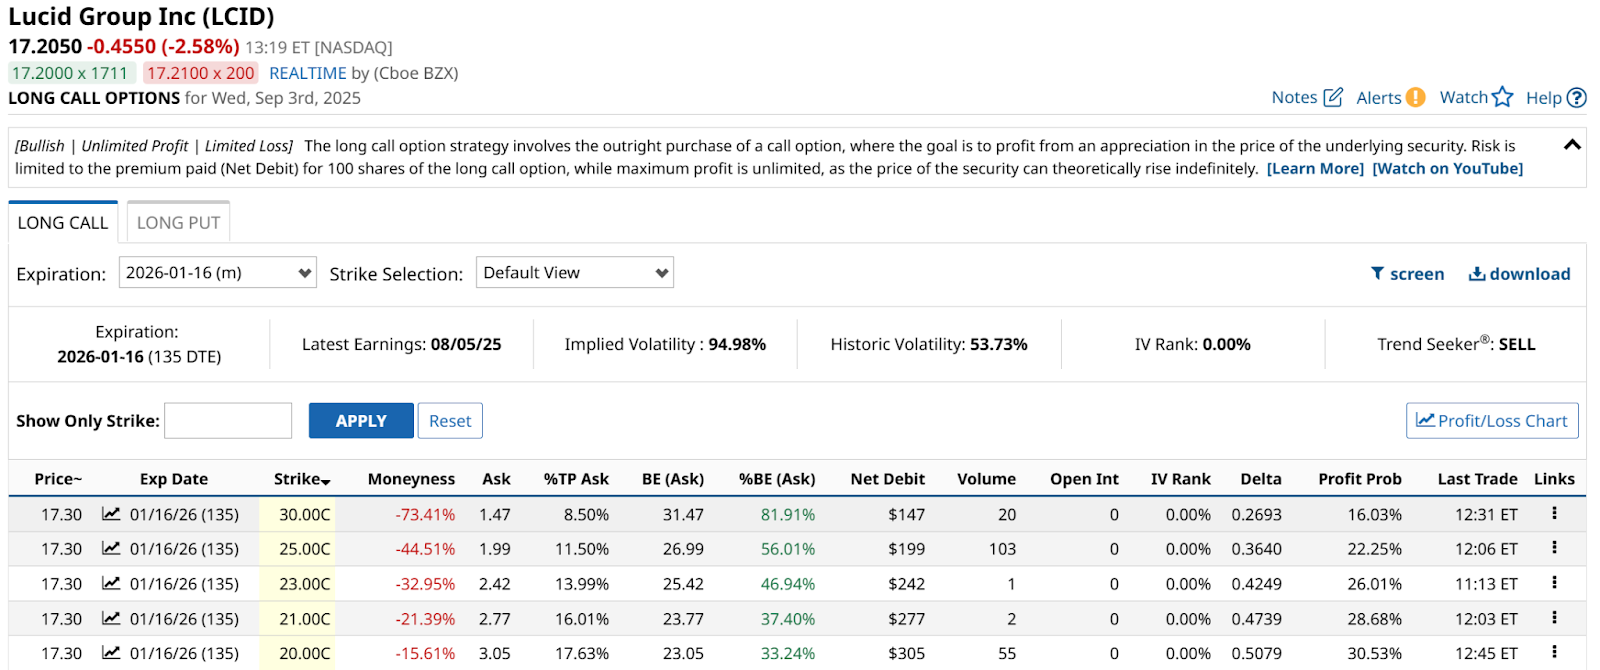
Above, you see 5 different variations on this, with strike prices from $20 to $30. The more upside you give yourself a chance to chase between now and mid-January, the less you receive in cash now for the calls.
I’m not in this one, but if I were pairing it with the $17 puts that cost me $4.10, and recalling from the daily chart above that LCID was at $30 as recently as this past May, I’d opt (yes, another intended pun) for the $25 strike. That brings in $1.99 and results in a net option cost of $4.10-$1.99=$2.11 a share.
In turn, that takes my strike price range of $25 to $17, and if I reduce each side by that $2.11 per share option cost, that produces an effective range through January expiration of $22.89 to $14.89. On a $17.20 stock, that’s $5.69 in upside versus $2.31 downside. Less than 2:1.
There are plenty of other combinations, even for a broken-down car stock like LCID. But this also reminds us of what collars do and don’t do. They can’t fix a flat tire. But they can be the donut that allows us to get to the next station with a chance to repair and move forward.
On the date of publication, Rob Isbitts did not have (either directly or indirectly) positions in any of the securities mentioned in this article. All information and data in this article is solely for informational purposes. For more information please view the Barchart Disclosure Policy here.