GameStop Corporation (NYSE:GME) was plunging about 8% lower on Friday, although due to a 4-1 stock split the stock appeared to be down 76%. The split brought shares of the video gaming retailer’s stock down from Thursday’s closing price of $153.47 to a split-adjusted price of $36.88 when the trading session opened.
The stock split means that every shareholder received 3 additional shares for each share of GameStop they owned. The split made shares of the company more attractive to retail investors and for options traders because the price of both calls and puts has become more affordable.
GameStop ran about 30% higher into the event, but is trading down 70% from the Jan. 28, 2021 split-adjusted all-time high of $120.75.
The patterns GameStop developed on its chart prior to the split taking place are still intact, although technical traders may need to redraw their patterns and levels of support and resistance now that GameStop’s stock price has essentially been divided by 4.
Want direct analysis? Find me in the BZ Pro lounge! Click here for a free trial.
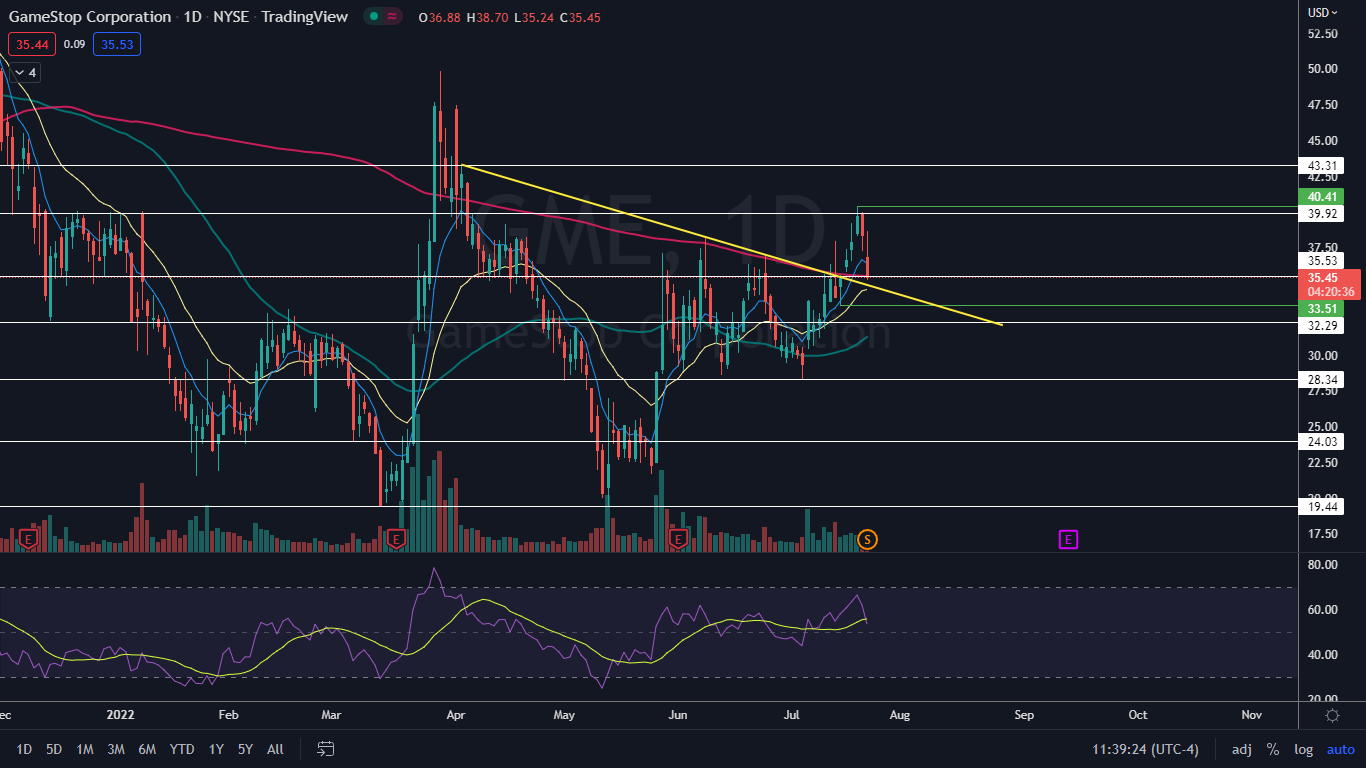
The GameStop Chart: GameStop has been trading in an uptrend since July 5, with the most recent higher high formed on July 20 at $40.41 and the most recent confirmed higher low printed at the $33.51 level on July 15. If GameStop is able to reverse course and trade north before falling under the $33.50 level, the uptrend will remain intact.
- On July 18, GameStop shot up above the 200-day simple moving average (SMA), which is a bellwether indicator to signal when a stock is in a bull or bear cycle. On Friday, GameStop fell down to test the 200-day SMA as support and as of press time, the stock was trying to hold above the level.
- GameStop broke up from a descending trendline on July 18, which had been holding the stock down since April 4. If GameStop drops under the 200-day SMA, the stock may find support at the descending trendline.
- The pullback was necessary and, so far, looks healthy because GameStop’s relative strength index (RSI) was measuring in at about 66% on Wednesday. When a stock’s RSI nears or reaches the 70% level it becomes overbought, which can be a sell signal for technical traders.
- If GameStop closes the trading day near its low-of-day price, the long upper wick could indicate lower prices will come again on Monday. However, if that happens, the stock will print an inverted hammer candlestick, which some traders view as bullish.
- If GameStop is able to rise up to close the trading day flat or near the high-of-day, the stock will print a doji or hammer candlestick, respectively, which could indicate the higher low has been set, and the GameStop will bounce higher on Monday.
- GameStop has resistance above at $35.53 and $39.92 and support below at $32.29 and $28.34.
See Also: Jim Cramer Warns Young Investors About 'Joke Cryptos' And The 'Invest By Anger' Method
Photo: Courtesy of Dicoplio Family on Flickr