/International%20Business%20Machines%20Corp_%20logo%20on%20storage%20rack-by%20Nick%20N%20A%20via%20Shutterstock.jpg)
International Business Machines Corp. (IBM) produced strong free cash flow guidance in its July 23 Q2 earnings release. Management said it now expects over $13.5 billion in FCF this year. That's 8.8% higher than 2024 and implies IBM stock could be worth 13% more at $294 per share. This article will show why.
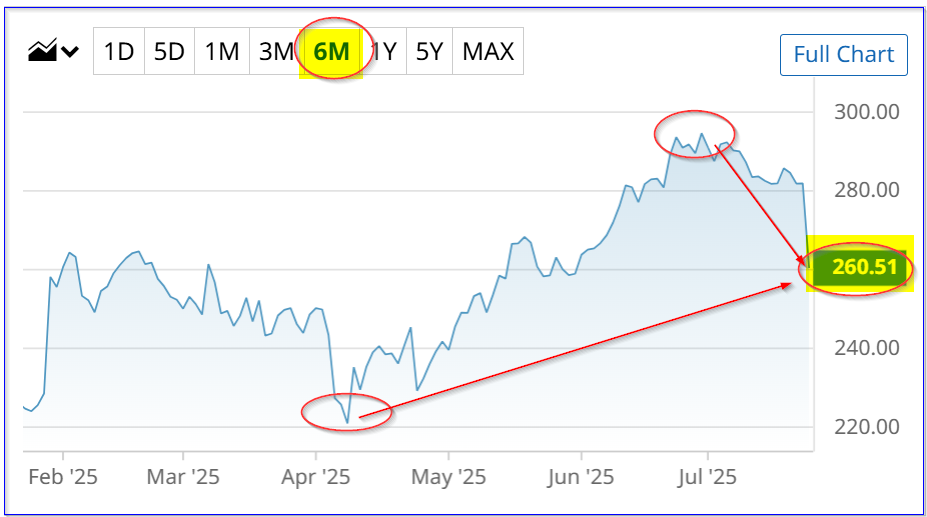
IBM closed at $260.51 on Thursday, July 24, down -7.6% for the day after its earnings release. IBM stock is well down from its recent peak of $294.78 on June 30.
That makes today's price a great buy-in opportunity for value investors. Moreover, it makes sense to sell out-of-the-money (OTM) put options for an even lower buy-in price (more on that below).
First, let's look at IBM's results and the strong free cash flow (FCF) guidance.
Strong Free Cash Flow (FCF) Outlook
On July 23, IBM reported +7.6% higher Q2 revenue at $16.977 billion, compared to $15.77 billion last year. This was driven by its software (+10% YoY) and infrastructure (cloud storage) segments, up 14%, while its consulting division sales were up 3%.
In addition, IBM's operating income before taxes grew +17% to $2.597 billion, with a strong operating margin of 15.3%, vs. 14.1% a year ago.
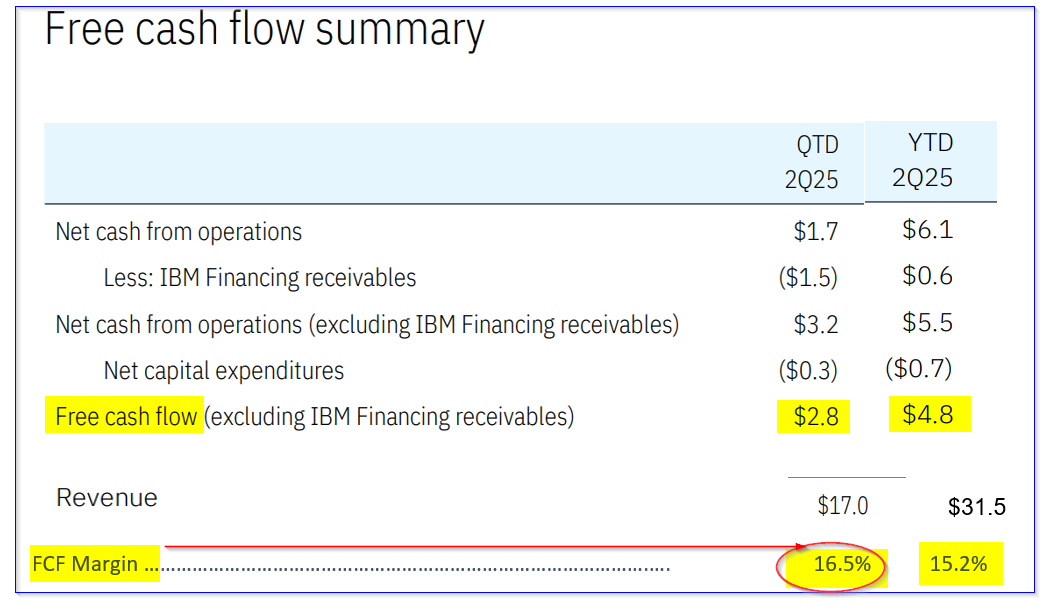
Moreover, the company's first half free cash flow (FCF), adjusted by excluding financing receivables, was $4.8 billion, representing over 15.2% of sales. Its Q2 FCF adjusted margin was higher at 16.5% (i.e., $4.8 billion/$17b sales), as can be seen from the company's earnings presentation deck:
As a result, management projected a strong free cash flow outlook. Here is what the CEO, Arvind Krishna, said:
“With our strong first-half performance, we are raising our full-year outlook for free cash flow, which we expect to exceed $13.5 billion."
Since the company also expects over 5% revenue growth (i.e., from $62.753 billion last year to $65.89 billion), this FCF represents a 20.5% FCF margin:
$13.5 billion FCF est. / $65.89 billion revenue = 0.2049 = 20.5% FCF margin
In other words, management expects FCF margins to rise substantially in the next 2 quarters from 16.5% in Q2 and 15.2% in H1. As a result, we can project higher FCF over the next 12 months (NTM).
Projecting FCF and Target Price
Analysts are even more ebullient about IBM's revenue prospects. The average of 21 analysts surveyed by Seeking Alpha is $66.6 billion for 2025, and $69.51 billion next year. That works out to an average next 12 months (NTM) revenue forecast of $68.06 billion.
Therefore, if IBM makes a 20.5% FCF margin, as management expects in 2025, its FCF could rise to almost $14 billion over the next 12 months:
$68.06 billion NTM sales x 0.205 = $13.95 billion NTM FCF
That would be +3.3% higher than management's expectation for 2025 and +13% over the $12.34 billion it made over the trailing 12 months (TTM), according to Stock Analysis. (That TTM FCF figure may not have added back financing receivables as the company does).
How will the market value this? One method is to use an FCF yield metric. That assumes that 100% of its FCF is paid out to shareholders in dividends. The resulting dividend yield is also equal to its FCF yield.
For example, the $12.34 billion TTM FCF represents 5.1% of its existing market value of $242.1 billion (Yahoo! Finance).
Therefore, it's reasonable to assume the market will value IBM with at least a 5.1% FCF yield over the next 12 months. That is the same as multiplying FCF by 19.6x (i.e., 1/0.051 =19.6):
$13.95 billion NTM FCF x 19.6 = $273.4 billion target
That is +12.9% over Thursday's market cap of $242.1 billion. In other words, IBM stock is worth at least 12.9% more or $294 per share:
$260.51 p/sh x 1.129 = $294.11 target price
Analysts Agree IBM is Undervalued
For example, Yahoo! Finance's survey shows an average analyst survey price target of $277.01, and Barchart's mean survey price is $269.95.
In addition, Stock Analysis says that 14 analysts have an average of $277.36. However, AnaChart.com, which tracks recent analysts' reports and recommendations, says that the average is $311.18.
As a result, the mean survey price target is $283.88 per share, which is close to our price target of $294.11.
However, there is no guarantee this will occur over the next 12 months. It could stay flat. As a result, it makes sense to set a lower buy-in target and get paid in the process.
Shorting OTM Puts
This is what happens when you enter an order to “Sell to Open” out-of-the-money (OTM) put options in nearby expiry periods - i.e., shorting OTM puts.
For example, look at the Aug. 22 expiration period, which is 29 days to expiry (DTE). The $250.00 exercise price in the put option chain shows that the midpoint premium is $2.80 per put contract.
So, the short-seller of these puts makes an immediate yield of 1.12% (i.e., $2.80/$250.00).
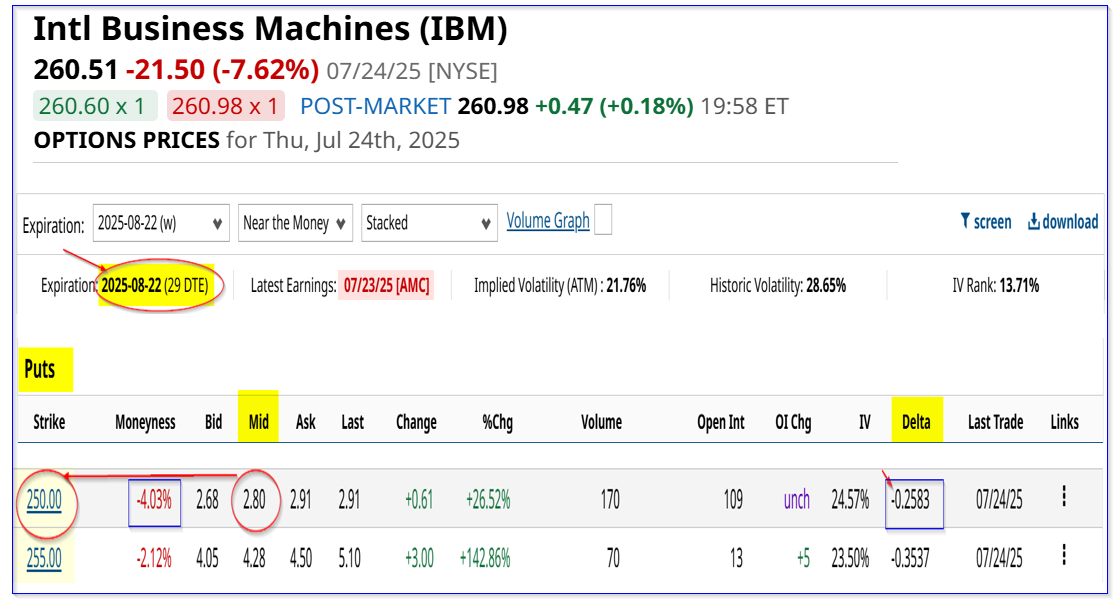
The reason is that the investor must secure $25,000 with their brokerage firm to do this trade. In return, the $2.80 put price represents $280 received (i.e., $2.80 x 100 shares per contract):
$280 / $25,000 = 0.0112 = 1.12% over 29 days
Note that this strike price is 4% below the trading price, i.e., out-of-the-money (OTM). However, the chance of IBM falling to this strike price is low, as the delta ratio is just 25.8%.
Moreover, the breakeven point, even if IBM stock falls to $250.00 on or before Aug. 22, is low at $247.20 (i.e., $250-$2.80). That is 5.1% below Thursday's closing price.
An investor willing to take on more risk could short the $255.00 strike price, i.e., 2% below the trading price. However, the short-put yield is higher at 1.68% (i.e., $4.28/$255.0).
The bottom line is that investors can set a lower buy-in price shorting OTM puts. Given that the stock is worth +13% more, based on FCF projections, that might work out well for investors over the next 12 months.
On the date of publication, Mark R. Hake, CFA did not have (either directly or indirectly) positions in any of the securities mentioned in this article. All information and data in this article is solely for informational purposes. For more information please view the Barchart Disclosure Policy here.