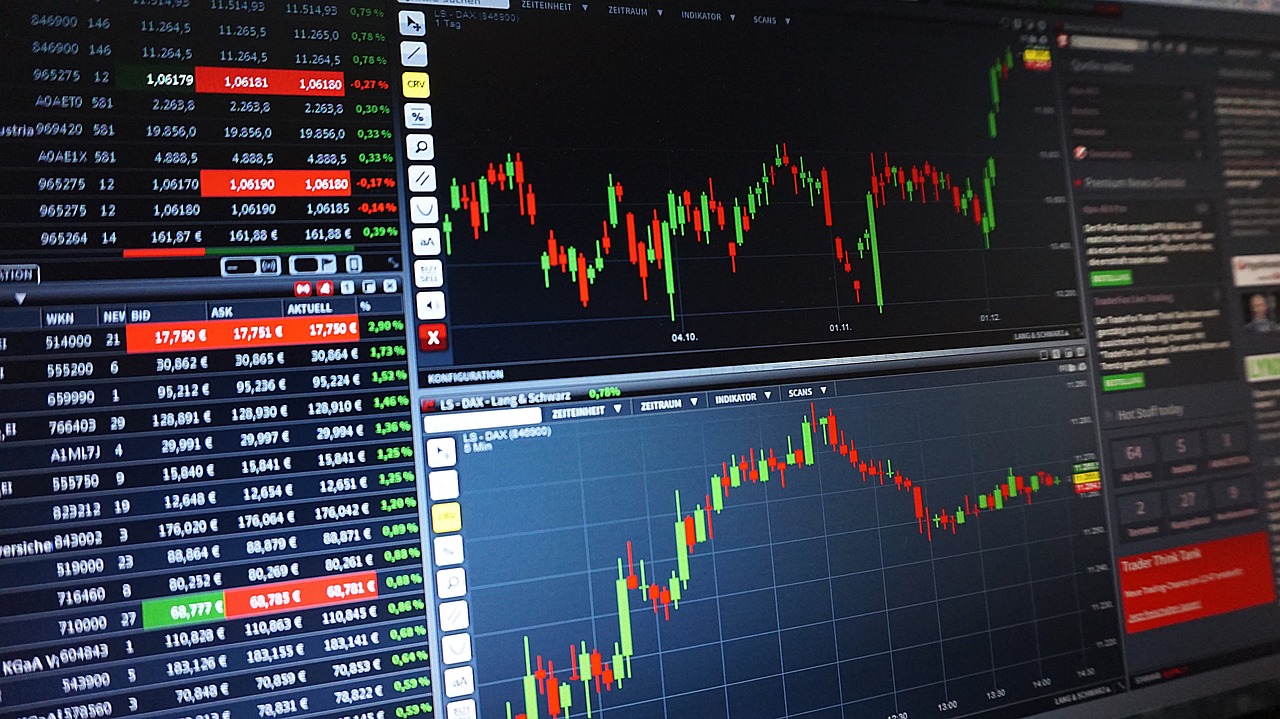
What if you could see every angle of the market in one view? With Barchart’s Grid Charts, you can. Whether you’re scanning dozens of tickers, comparing multiple timeframes, or building a custom strategy dashboard, Grid Charts give you professional-level insights without the complexity.
In this walkthrough, we’ll show you how to use Grid Charts across Interactive Charts, Flipcharts, and Dashboards — and how to save your setups as templates so you never have to rebuild them.
What Are Grid Charts?
Grid Charts let you split your screen into 2 to 6 panels. Each panel can show the same stock in different timeframes (perfect for multi-timeframe analysis), or different symbols side by side. You control what’s synced: symbol, interval, indicators, bar type, and templates.
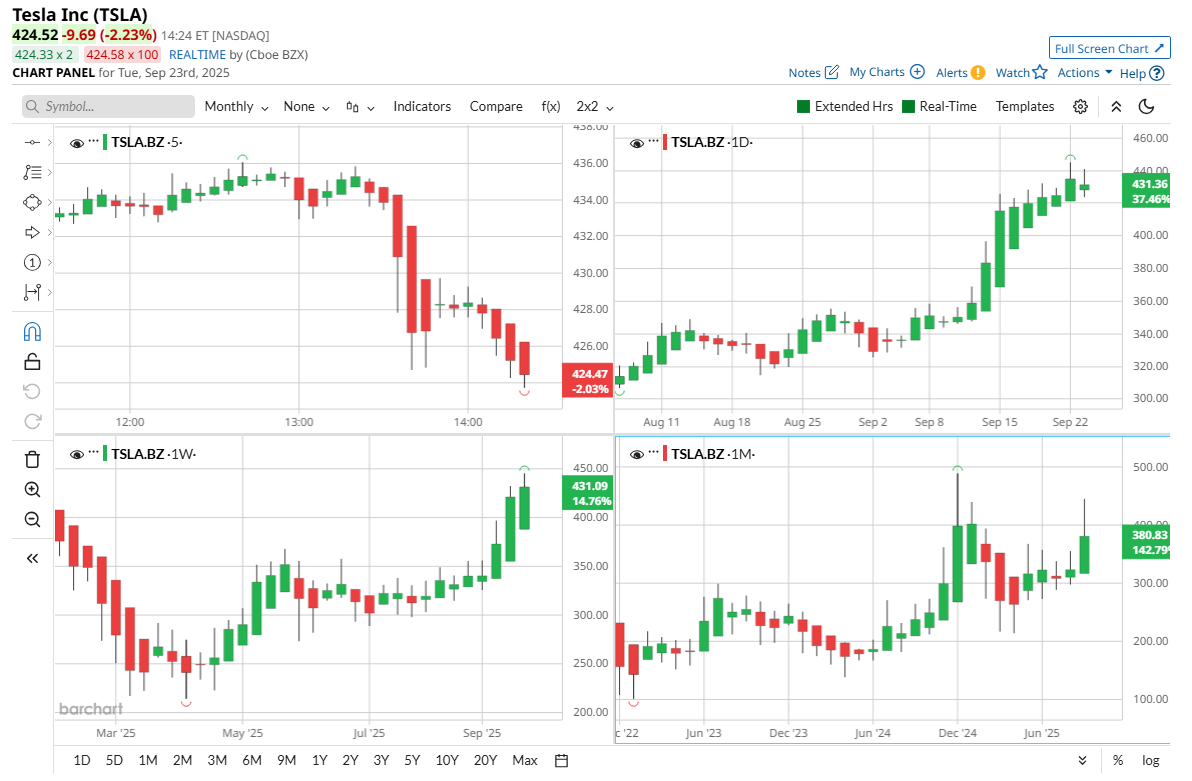
Example: Perform a top-down analysis and compare Tesla (TSLA) on a 5-minute chart, daily chart, and weekly chart — all in one dashboard.
Sync Settings Explained
The real power of Grid Charts comes from Sync Settings. Toggle on or off:
- Symbol Sync: Keep every pane focused on one ticker.
- Interval Sync: Align all charts to the same timeframe.
- Indicators Sync: Apply indicators (like RSI or Bollinger Bands) to all panes at once.
- Template Sync: Pull up your favorite saved chart template in every pane instantly.
Save your custom layouts as Grid Templates and reload them anytime.
Flip Through Stocks Faster with Flipcharts
When you’re screening for opportunities, Flipcharts + Grid Charts = speed. Apply your chart template once, then flip through up to 6 assets at a time. Each pane updates instantly, so you can compare setups at a glance without scanning charts one by one.
Pro tip: Use this with Barchart’s Top 100 Stocks or Top 100 ETFs Screeners to quickly spot momentum.
Maximum Flexibility with Dashboards
The Dashboard takes Grid Charts to the next level. Unlike Interactive Charts & Flipcharts, every pane can be unique — different tickers, different timeframes, even different indicators.
For example:
- Pane 1 → Apple (AAPL) daily chart with Bollinger Bands
- Pane 2 → Nvidia (NVDA) weekly chart with RSI
- Pane 3 → iShares Russell 2000 ETF (IWM) intraday chart with Heikin Ashi bars
All in one screen:
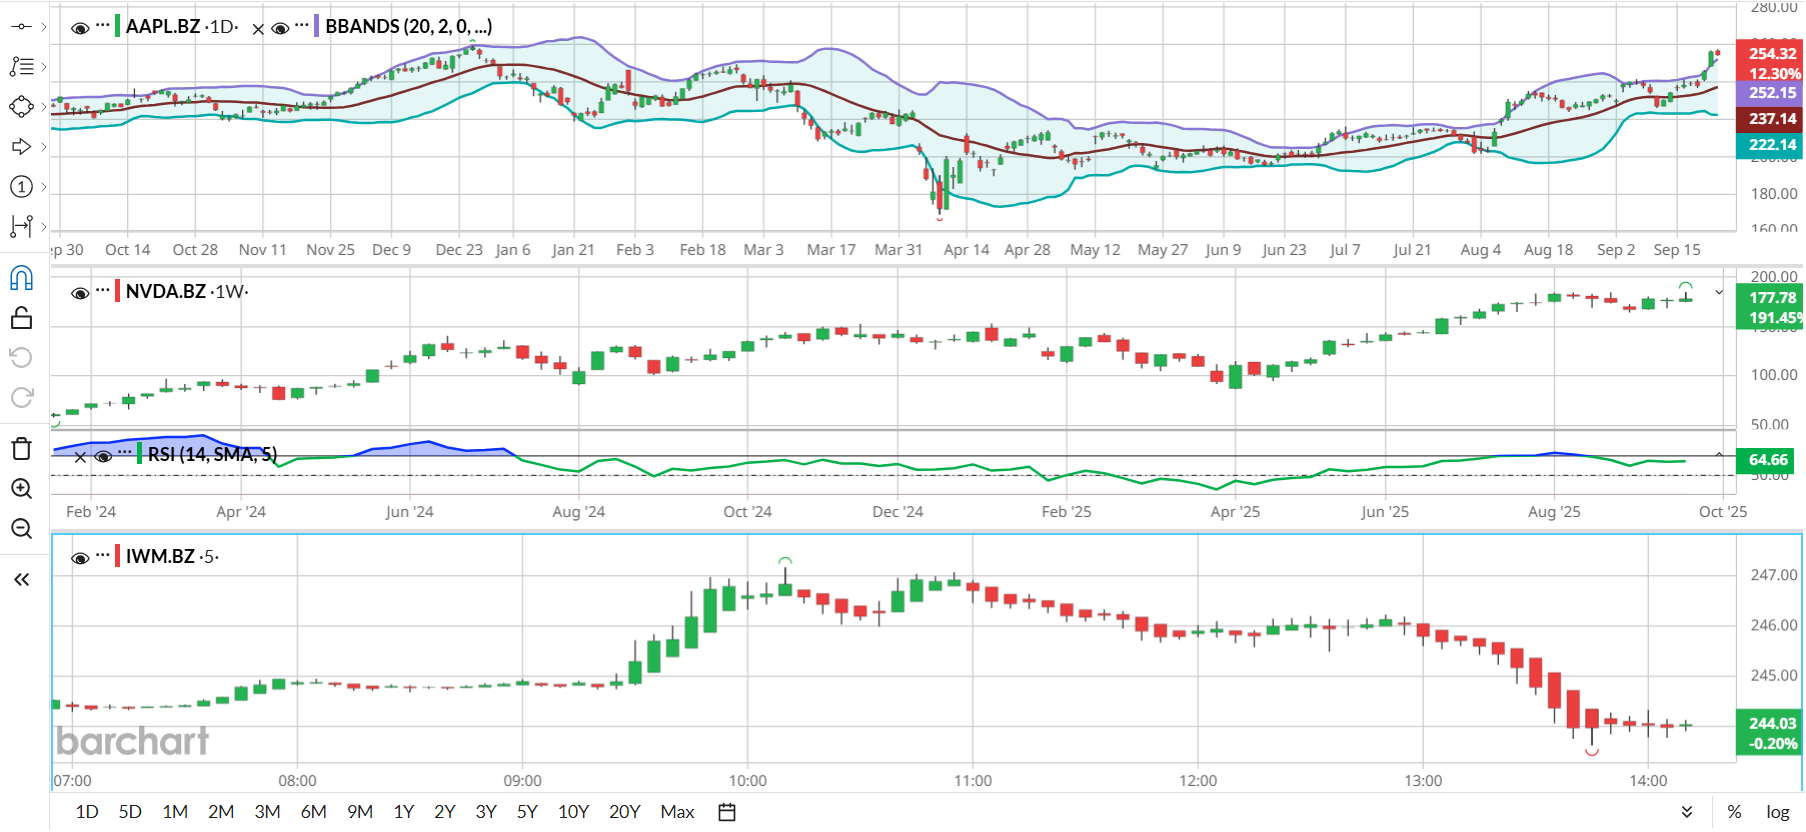
You can even click directly from your Watchlist into a pane, building a customized trading command center.
Why Grid Charts Matter for Traders
- Save Time: No more flipping tabs or reloading templates.
- See More: Compare sectors, tickers, and timeframes instantly.
- Stay Ready: Save Grid Templates and reload them for any trade idea.
Grid Charts aren’t just a convenience — they’re a performance edge.
Watch our full tutorial video now and start building your ultimate trading dashboard on Barchart.
Watch the Grid Charts Walkthrough →