MGM Resorts International (NYSE:MGM) is set to print its first-quarter financial results after the market close on Thursday. The stock was trading flat heading into the event.
When the global hospitality and entertainment company printed its first-quarter results on Feb. 9, the stock plunged into a downtrend, declining more than 25% between that reporting date and March 8, when the stock reached a bottom at the $36.46 mark. Since reaching the low, MGM has seesawed between about the $36 and $44 levels amid increased market volatility.
For the first quarter, MGM printed a massive beat, reporting an EPS of 12 cents compared to the analyst estimate of 2 cents. For the first quarter, analysts estimate MGM will report a loss of 7 cents per share.
The reaction MGM receives post-earnings is likely to be the deciding factor on whether the stock will trade in bullish or bearish territory for the time being, because MGM has lacked direction for awhile. Of course, holding stocks or options over an earnings print is akin to gambling because stocks can react bullishly to an earnings miss and bearishly to an earnings beat. Options traders particularly, those who are holding close dated calls or puts, take on extra risk because the intuitions writing the options increase premiums to account for implied volatility.
The implied move for options of MGM expiring this week is 7.72%.
Want direct analysis? Find me in the BZ Pro lounge! Click here for a free trial.
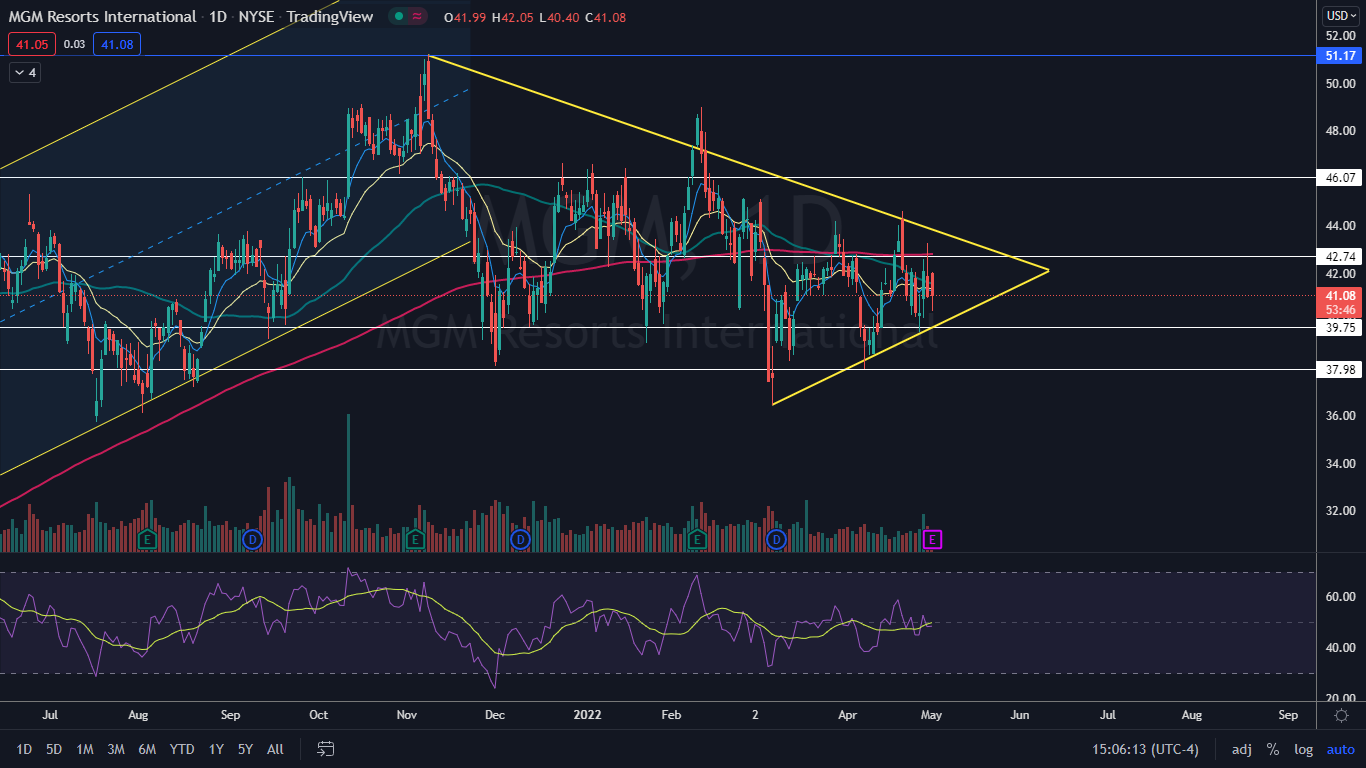
The MGM Chart: MGM has been trading in a triangle pattern since reaching a new all-time high of $51.17 on Nov. 8, 2021. Although the stock has entered into shorter-term uptrends and downtrends since that date, over the longer-term the stock has been making lower highs and higher lows.
- MGM will reach the apex of the triangle on June 9 and traders and investors can watch from a break up from the upper descending trendline or a break down from the lower ascending trendline on higher-than-average volume to gauge future direction. Due to the stock’s impending earnings print, the break is likely to come sooner.
- MGM is trading just below the 200-day simple moving average, which acts as a strong indicator as to whether a stock is in a bull or bear market. The reaction to MGM’s earnings will likely determine which side of the 200-day SMA MGM trades on for a period of time and will give traders a strong indication of future direction.
- MGM has resistance above at $42.74 and $46.07 and support below at $39.75 and $37.98.