Bollinger Bands are one of the most widely used technical tools for spotting potential breakouts or reversals. But as John Rowland, CMT, explained in his recent webinar, using them alone can sometimes produce false signals.
That’s why he adds a second layer: the Average True Range (ATR).
The 1.5x ATR Rule
Here’s the process John uses:
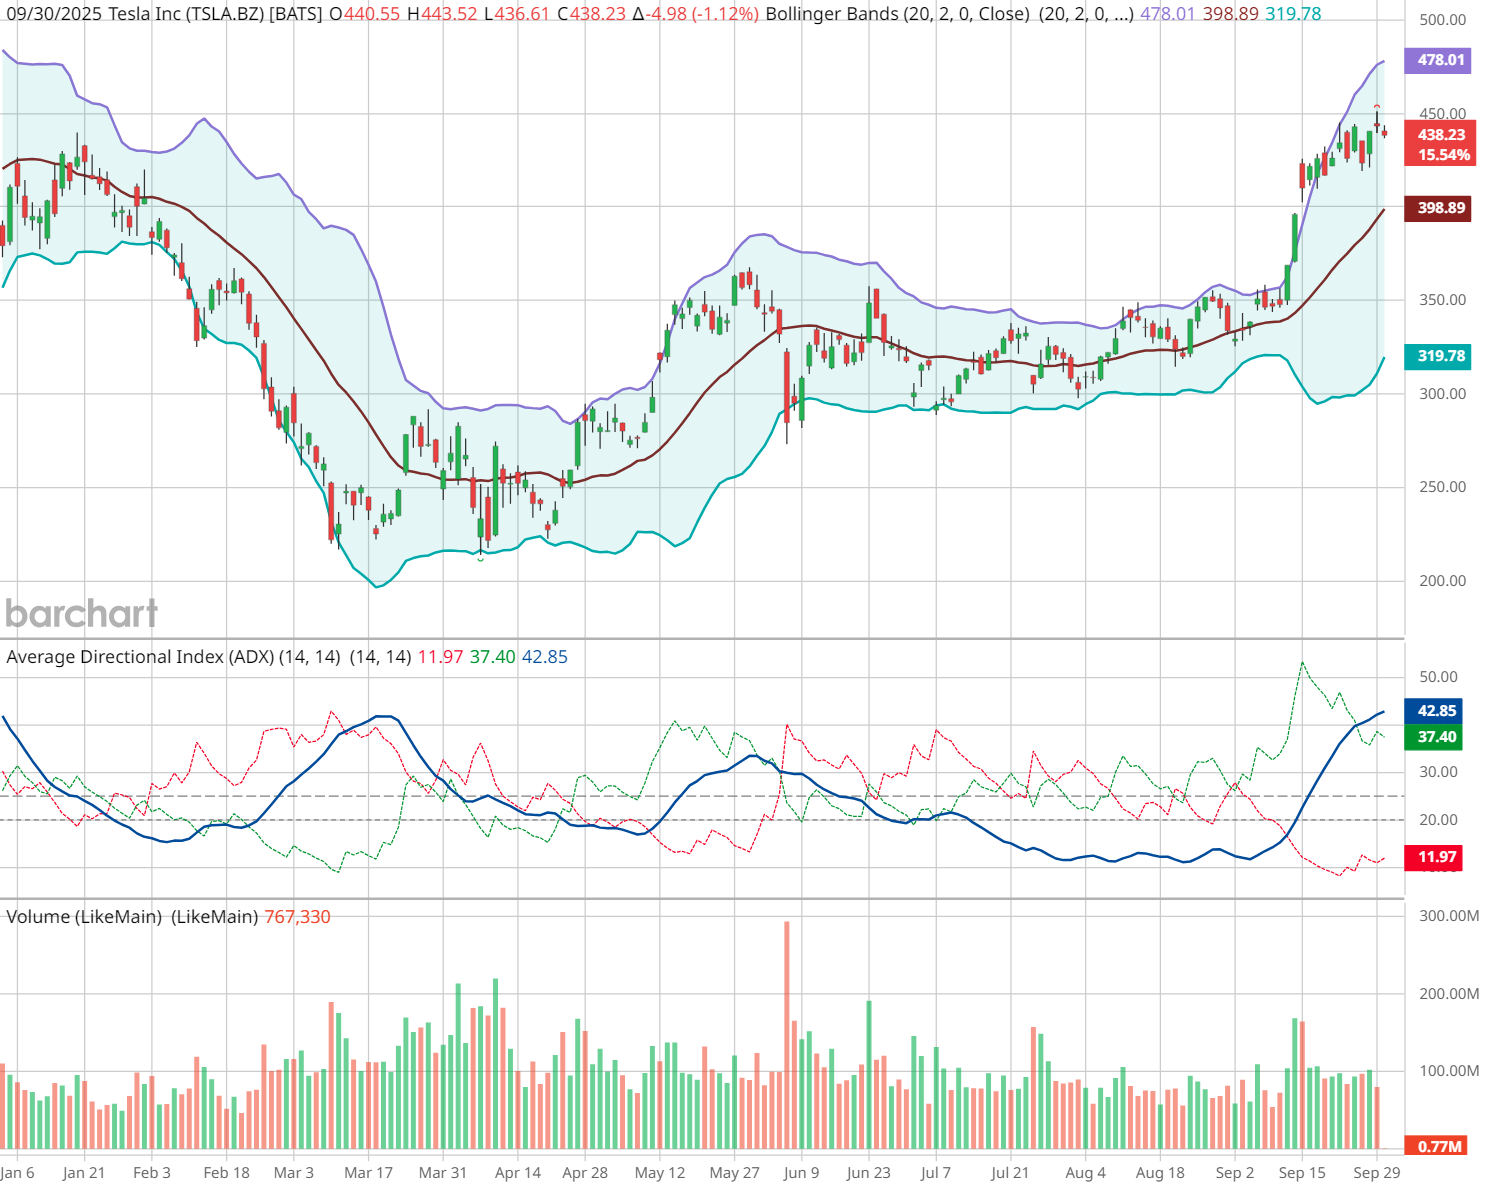
- Check ATR for volatility context. For example, Tesla’s ATR was about 14 points.
- Multiply by 1.5. That gave a breakout threshold of ~21 points.
- Confirm breakout above that threshold. If Tesla closed above $378 (ATR-adjusted breakout), it validated the move. This started a strong trend, pushing TSLA to over $400.
Used in this way, ATR acts as a qualifier to filter out weak moves.
Volume + Bollinger Bands = Extra Confirmation
Regular followers of John's analysis know that volume is perhaps the most significant indicator of all.
- Breakouts: Price pushing outside the bands + ATR move + rising volume = stronger conviction.
- Reversals: Price pierces outside but then closes back inside the bands. ATR stagnation or exhaustion + volume spikes can signal a turning point.
John pointed out Tesla (TSLA) as a textbook case:
A large bearish candle closed outside the bands on 6/5/2025, but the lack of sustained ATR expansion suggested momentum might be fading. Volume peaks helped validate the exhaustion as price moved sideways for months.
Put This Strategy In Action
You can replicate this analysis directly on Barchart:
- Interactive Charts → Add Bollinger Bands and ATR to spot qualifying breakouts
- Technical Analysis page → Monitor ATR alongside RSI, stochastics, and more
- Barchart Screeners → Filter for stocks with unusual ATR or Bollinger Band activity
The Takeaway
On their own, Bollinger Bands tell you where price is stretched. But pairing them with ATR — and John’s 1.5x rule — helps separate the true breakouts from the fake-outs.
Watch the clip from John’s webinar →
- Stream the full webinar on Bollinger Bands
- Try Bollinger Bands + ATR on Barchart Interactive charts