The BBC's decision to relocate thousands of staff to Salford has prompted a property boom which pushed up prices in the area faster than anywhere in England outside London last year.
Official figures from the Land Registry reveal that Salford was the metropolitan district with the biggest annual price rise – 6.8%, compared with an average of 1.7% for England and Wales.
The BBC's £1bn investment in Salford, including the transfer of flagship programmes such as Match of the Day, BBC Breakfast and Blue Peter as well as more than 2,300 staff, helped the area defy price falls averaging 3.5% elsewhere in the north- west during 2012.
Only Greater London outstripped Salford, with average prices in the capital surging by 8.4% to £371,223 – four times the price of a typical home in Manchester.
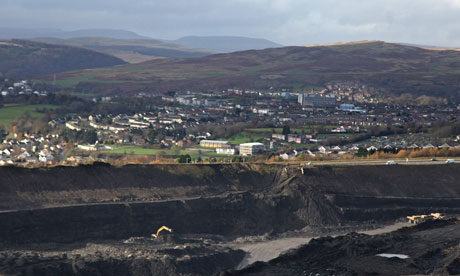
North-east Lincolnshire, which encompasses Grimsby and Cleethorpes, saw the biggest fall in 2012, with property values slumping 9.5%. Merthyr Tydfil, long a byword for industrial decline and deprivation, saw a surprise 20.3% gain, although the Land Registry warned that the figure was based on low levels of transactions
The average price of a home in the UK rose to £162,080, but this figure masks vast regional differences.
Kingston upon Hull, where the average home costs £68,710, down 2.1% on the year, is the authority with the lowest prices in England and Wales.
At the other end of the scale, Kensington and Chelsea in London has become the first borough to see average prices break the £1m barrier. The average home in the borough, which stretches from Knightsbridge to Notting Hill, costs £1,080,479, up 13.4% on the year. Five years ago the average price in the area was £750,000.
The Land Registry said the data was based on falling volumes of sales across the country. It said sales per month across England and Wales fell to 57,661 in the final quarter of 2012, compared with 62,073 in the same period a year earlier.
The Land Registry data is regarded as the most comprehensive record of price movements in England and Wales (not Scotland), with a database of 17m sales since 1995. Its figure of a 1.7% rise during 2012 contrasts with the Halifax house price index, which showed a fall of 0.3% for the year, and the Nationwide's index, which said prices fell by 1%.
The month-by-month figure from the Land Registry is also at odds with the two mortgage lenders. The Land Registry said prices rose by 0.8% in December, while Halifax said they were up 1.3% and Nationwide said they fell 0.1%.
The official figures also show that repossessions fell during 2012 and are running at about 1,500 a month, down from 1,850 during 2011. At the peak of the financial crisis in late 2008 and early 2009 repossessions were running at around 3,000 a month.
Average house prices in England and Wales remain 11% below the peak reached in November 2007, just as the financial crisis was beginning to unfold with the collapse of Northern Rock. But in Greater London prices have hit one new peak after another. The average price of a home in the capital is now £371,223 – or 6% higher than in 2007.
In Nottingham the average price of £84,683 is the same as it was in 2003.
A growing number of towns and cities across England and Wales have average prices below £100,000, including Blackpool (where prices dropped 4.6% in 2012), Darlington (down 7.4%), Hartlepool (4.7% lower), Stoke (down 1.5%), and Manchester (a 2.5% fall). The Olympics appear to have had a mixed effect on London property prices. In Newham, the borough where the Olympic Park is located, prices rose an average of 4.6%, while in nearby Hackney prices jumped by 10.3% – the third biggest gain in the capital. But Barking and Dagenham recorded a rise of just 0.1% to £210,944, while Redbridge, another east London borough, was the only part of the city to witness a price fall, down by 0.2% over the year.
The Land Registry also records the highest and lowest prices paid every month. It said that in December 2012 a property in Knightsbridge sold for £14m, the highest in England and Wales, while the cheapest house sale was for £10,000 in Blaenau Gwent, Wales.
Biggest risers 2012
Rise Average
Merthyr Tydfil* 20.3% £73,662
Greater London 8.4% £371,223
Salford 6.8% £91,508
Brighton & Hove 5.3% £229,004
Anglesey 5.1% £134,328
West Berkshire 5.% £232,043
Swansea 4.8% £112,007
Flintshire 4.5% £126,656
Bristol 3.5% £169,667
Oxfordshire 3.0% £243,237
Surrey 3.0% £303,700
Biggest fallers 2012
Fall Average
NE Lincolnshire -9.5% £75,775
St Helens -7.8% £91,678
Darlington -7.4% £98,555
Bolton -6.3% £88,513
Oldham -6.3% £79,615
Bridgend -6.1% £111,151
Bradford -6.0% £93,472
Hartlepool -4.7% £74,702
Northumberland -4.1% £121,834
Source: Land Registry, England & Wales. *Based on low sales volumes, likely to be an 'erratic' figure