Alibaba Group Holdings, Inc (NYSE:BABA) stock is rallying in Thursday's trading session after closing slightly lower on Wednesday.
Traders and investors are optimistic that beaten down Chinese-based stocks could regain ground as China eases regulatory restrictions on its big tech companies in an attempt to revive its economy.
According to a report by Bloomberg, Jack Ma’s Ant Group Co, in which Alibaba owns a one-third stake, is likely to apply to The People's Bank of China to become a financial holding company. The move further suggests China’s regulators and its big tech companies are coming closer together to resolve their issues.
JPMorgan’s flagship China fund has increased its position in Alibaba, according to filings submitted in May. The fund sees China’s harsh regulatory crackdowns nearing an end and noted China’s tech sector provides “critical value” to its customers.
The easing of China’s multipronged crackdown on its tech companies could definitely boost Alibaba’s stock, which is trading down about 67% from its Oct. 27, 2020 all-time high of $319.32.
The general markets could hamper a larger swing to the upside, with the S&P 500 officially in a bear cycle after plunging more than 20% off its all time high on June 13.
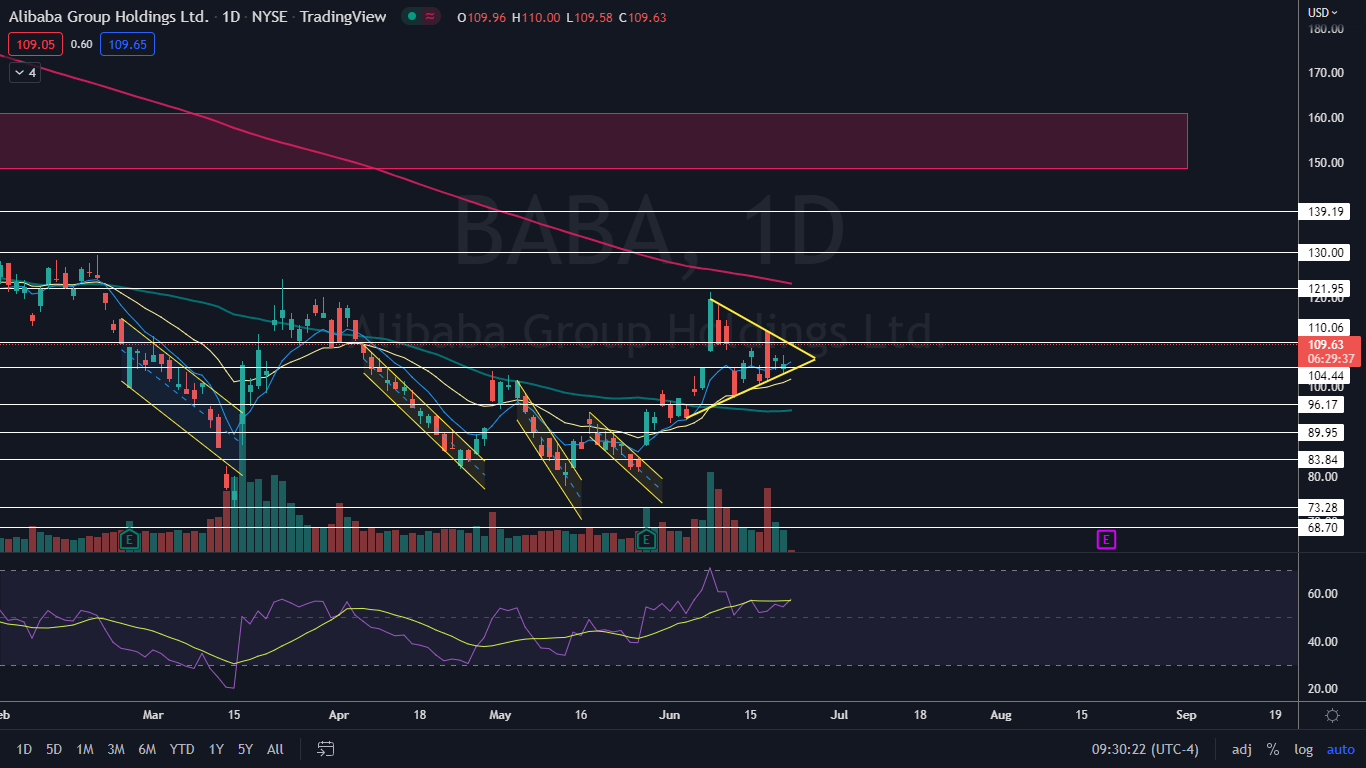
The direction Alibaba will head in, at least for the short-term, looks set to be determined soon because the stock has set itself into a symmetrical triangle pattern on the daily chart. A break from the formation is likely to set the path ahead.
Want direct analysis? Find me in the BZ Pro lounge! Click here for a free trial.
The Alibaba Chart: Alibaba began trading in a symmetrical triangle pattern on June 8, although the stock had been holding above the lower ascending trendline of the formation since June 3.
Alibaba is set to meet the apex of the triangle on June 28, and traders and investors can watch for a break up or down from the pattern on higher-than-average volume in order to gauge future direction.
- The symmetrical triangle is neutral because although Alibaba has been trading higher recently, the overall trend on larger timeframes is a downward one. The stock has developed some bullish signals that point to a bullish break from the pattern, such as support of moving averages.
- Alibaba is trading above the eight-day and 21-day exponential moving averages (EMAs), with the eight-day EMA trending above the 21-day, both of which are bullish indicators. The stock is also trading above the 50-day simple moving average (SMA), which indicates longer-term sentiment has turned bullish.
- Bulls want to see Alibaba break up from the upper descending trendline of the triangle and then for momentum to push the stock up over the 200-day SMA. Bears want to see big bearish volume come in and drop Alibaba down through the bottom trendline of the triangle, which would cause the stock to lose support of the EMAs.
- Alibaba has resistance above at $110.06 and $121.95 and support below at $104.44 and $96.17.