
Last week saw the S&P 500 Index post a new 4-month low, taking out the previous mark of 5,696.51.
-
Historically, a move to a new 4-month low would confirm the beginning of a new long-term downtrend.
Active Investor: FREE newsletter going behind the headlines on the hottest stocks to uncover new trade ideas Also, last week's activity is what could differentiate the most recent bearish technical reversal pattern from the previous two, both of which failed.
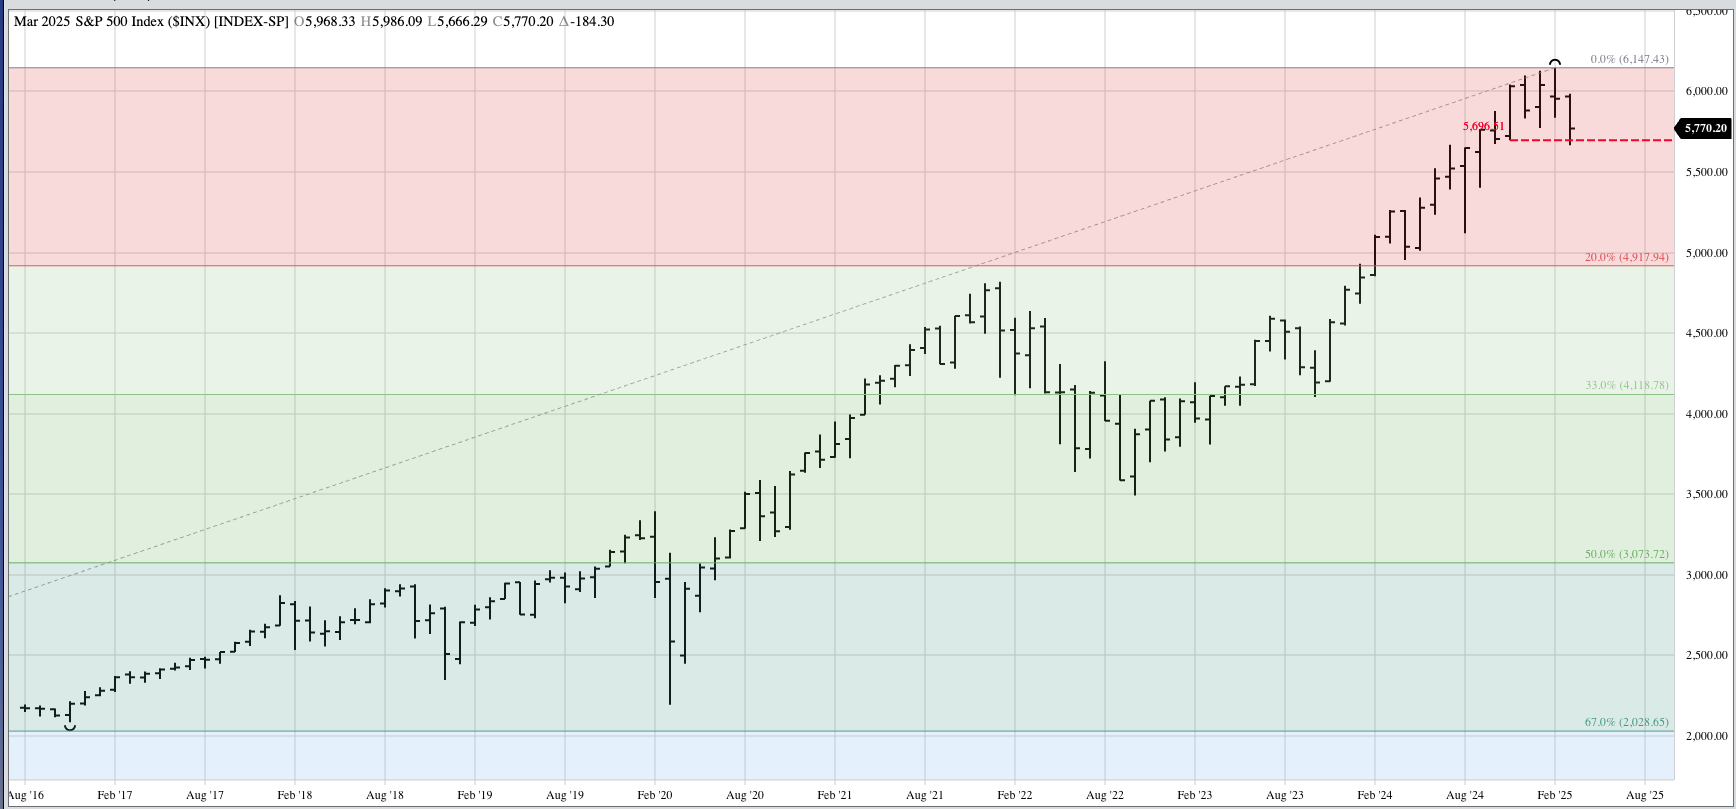
There is a lot going on with US stock indexes in general, the S&P 500 index ($INX) in particular, as we near the midpoint of March. Last week saw the S&P fall to a low of 5,666.29, taking out its previous 4-month mark of 5,696.51 from last November. From a technical point of view, this would confirm the index has moved into a major long-term downtrend. The previous uptrend began with the bullish spike reversal back in October 2022, starting with the low of 3,491.58 and running through the February 2025 high of 6,147.43. What should we make of this?
- While 4-month highs and lows are some of the more reliable indicators I watch for, I'll still argue that the value of technical analysis in general is questionable. Algorithms are too easily swayed by statements from the US administration, often done solely for the purpose of creating a market reaction.
- We've seen previous bearish reversal patterns that didn't hold:
- A bearish spike reversal at the conclusion of October 2024
- Another bearish spike reversal at the end of December 2024
- It should be noted this month's move to a new 4-month low is actually an extension of the most recent bearish spike reversal completed during February 2025.
- It's the 4-month low that makes this one different than the two previous patterns
If the major trend has turned down, technically, then some key downside numbers are:
- The 20% retracement level of 4,917.94
- Theoretically, the 20% retracement level is what makes a change in trend bearish
- If a stock index retraces more than 20% of its value it is said to be a “bear market”
- Dow Theory Retracement Targets (Keeping in mind algorithms likely use Fibonacci retracement numbers)
- 33% ~ 4,118.78
- 50% ~ 3,073.72
- I would expect the 33% level to hold the major downtrend