What you need to know
- Gemini's Deep Research feature can now mix interactive visuals into its text-based reports.
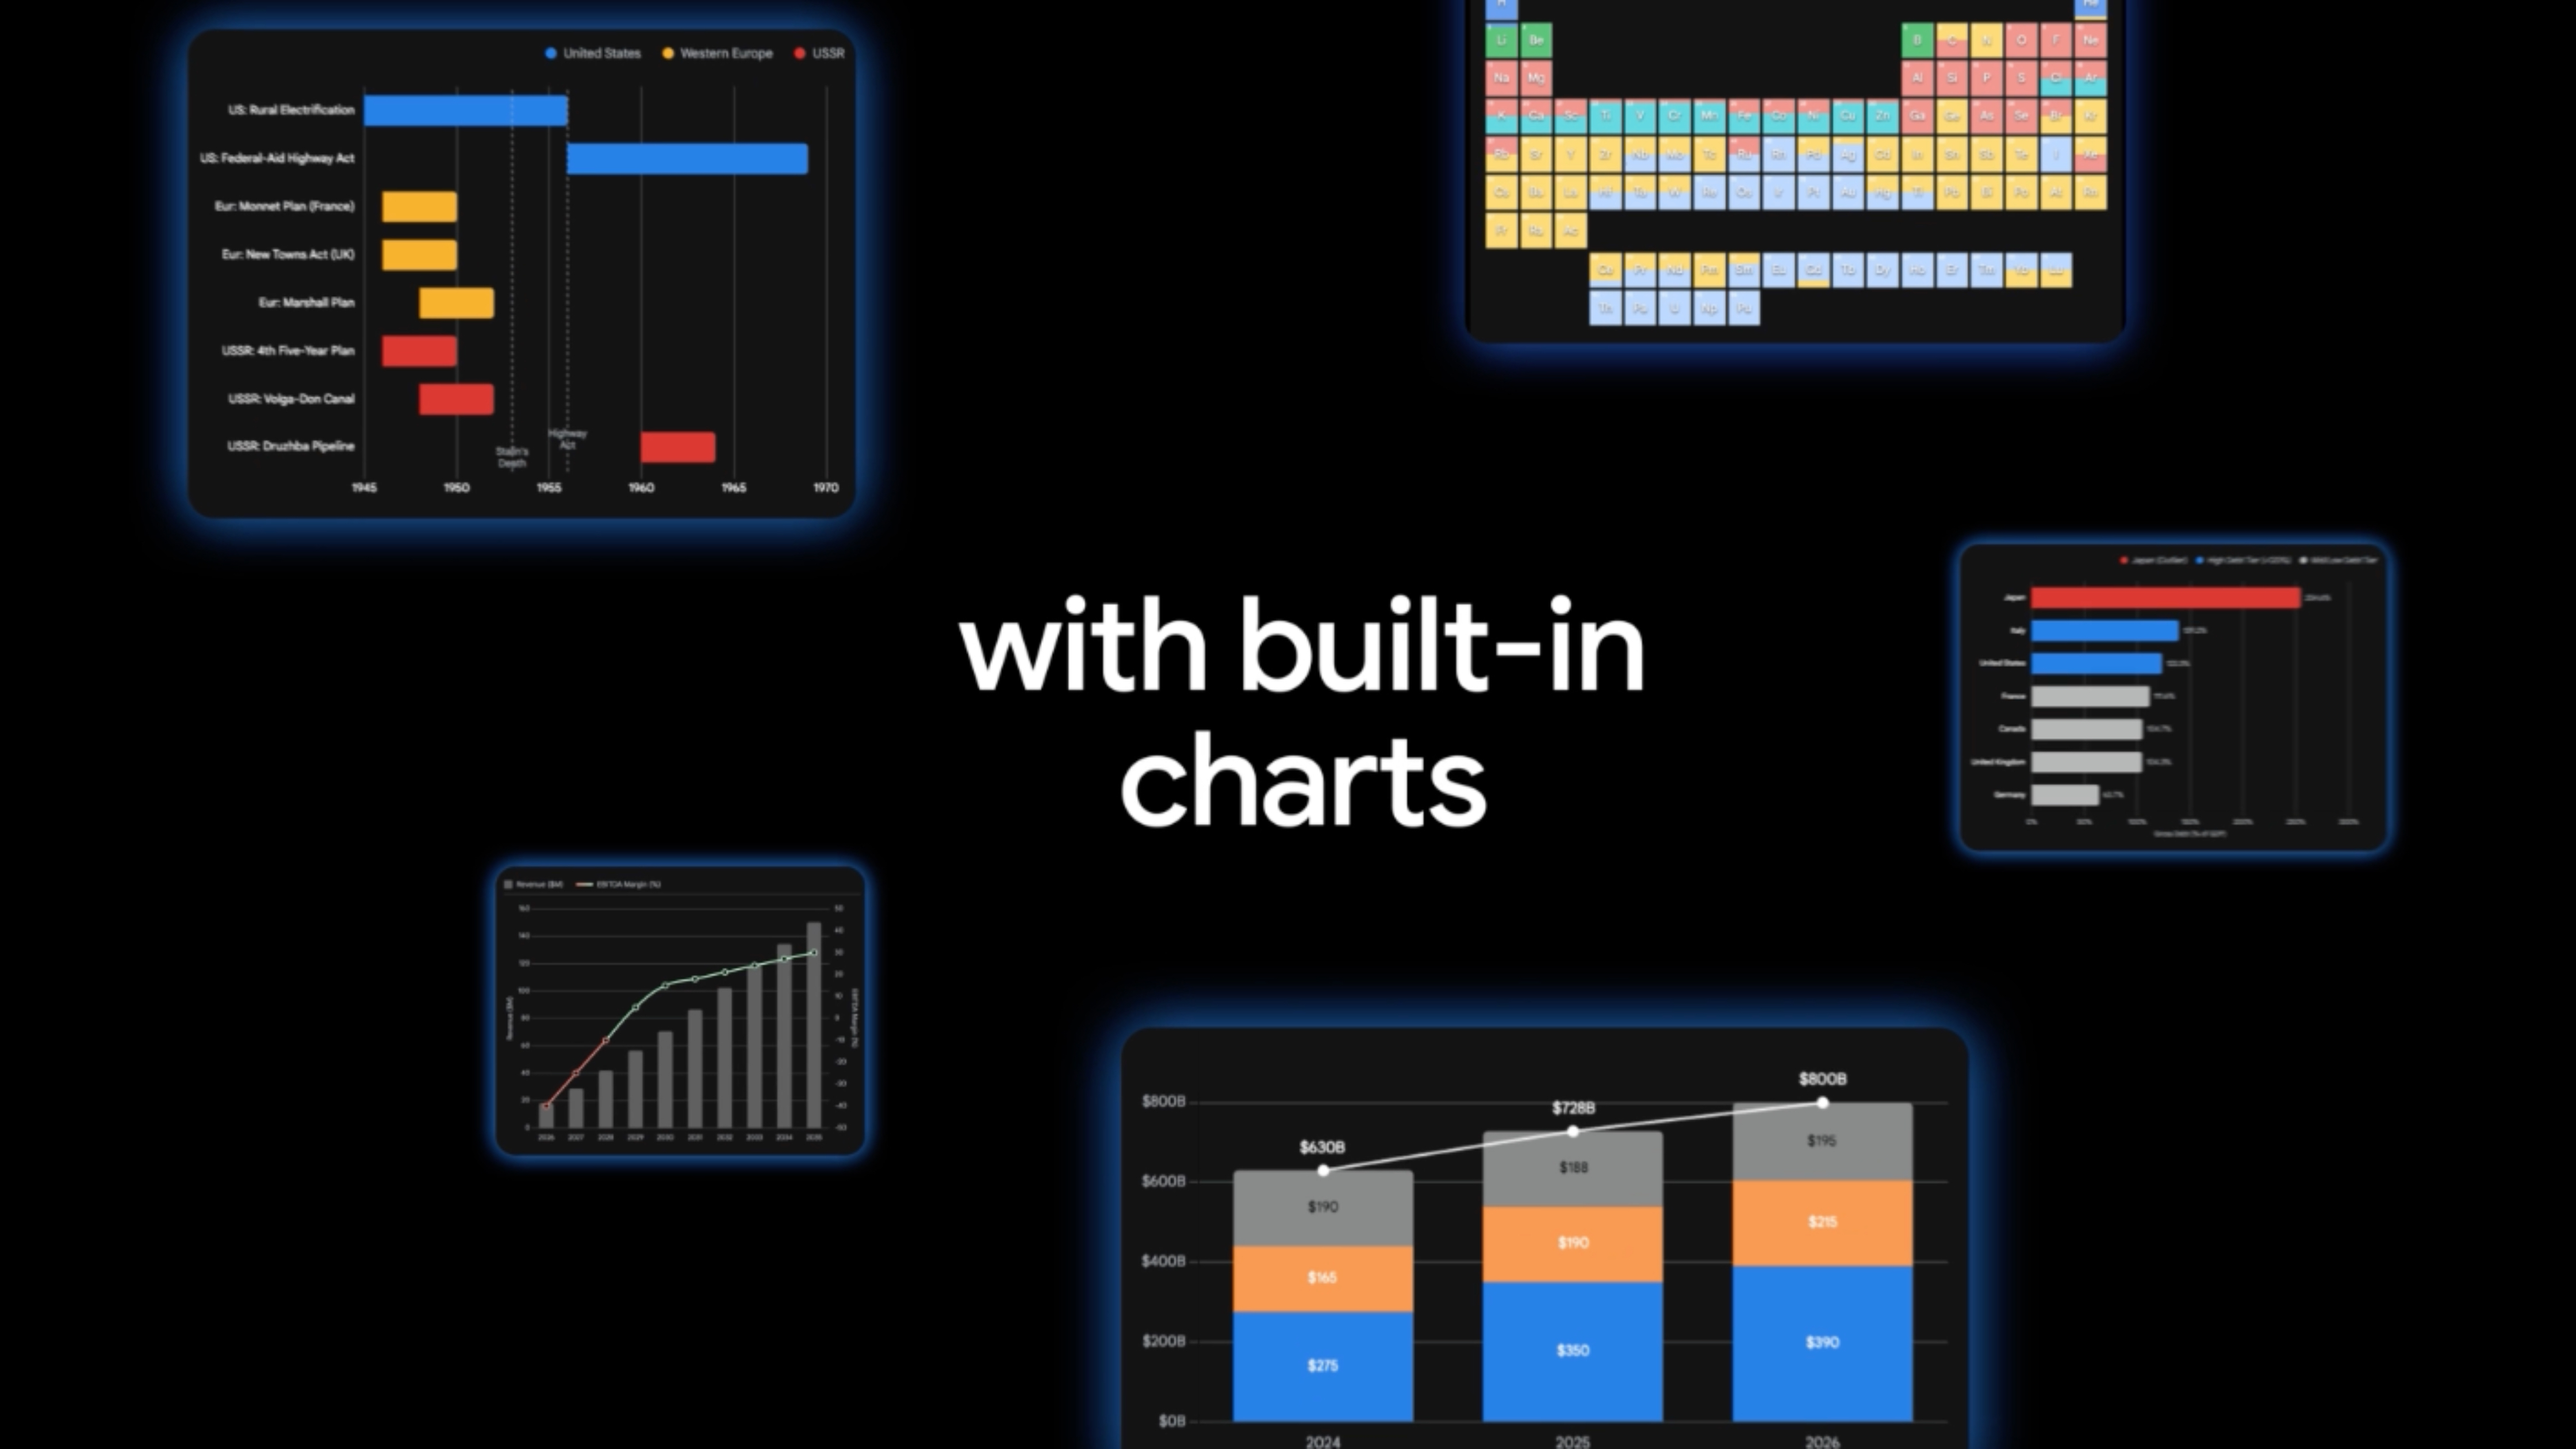
- Deep Research creates charts, interactive simulations, images, diagrams, and schematics using AI.
- The feature is currently limited to Google AI Ultra subscribers.
Gemini's Deep Research tool helps you conduct thorough web analysis tasks with the help of artificial intelligence. It can also take in data from your Gmail, Google Drive, and Google Chat history to provide additional context for Deep Research reports. Starting today, these research reports can now be transformed into interactive visual content in Canvas, Google announced in a blog post.
After generating a text-based report, Deep Research can now use its findings to create a visual report complete with images, charts, and simulations. It's similar to the generative UI feature added to AI Mode in Google Search, which uses AI to create graphics and simulations in real time.
"Whether you're allocating a marketing budget or exploring complex scientific theories, Gemini can now automatically illustrate your findings," Google explains in the blog post. "Instead of just reading about a strategy, you can interact with a dynamic simulation model within your report to forecast outcomes based on different variables."
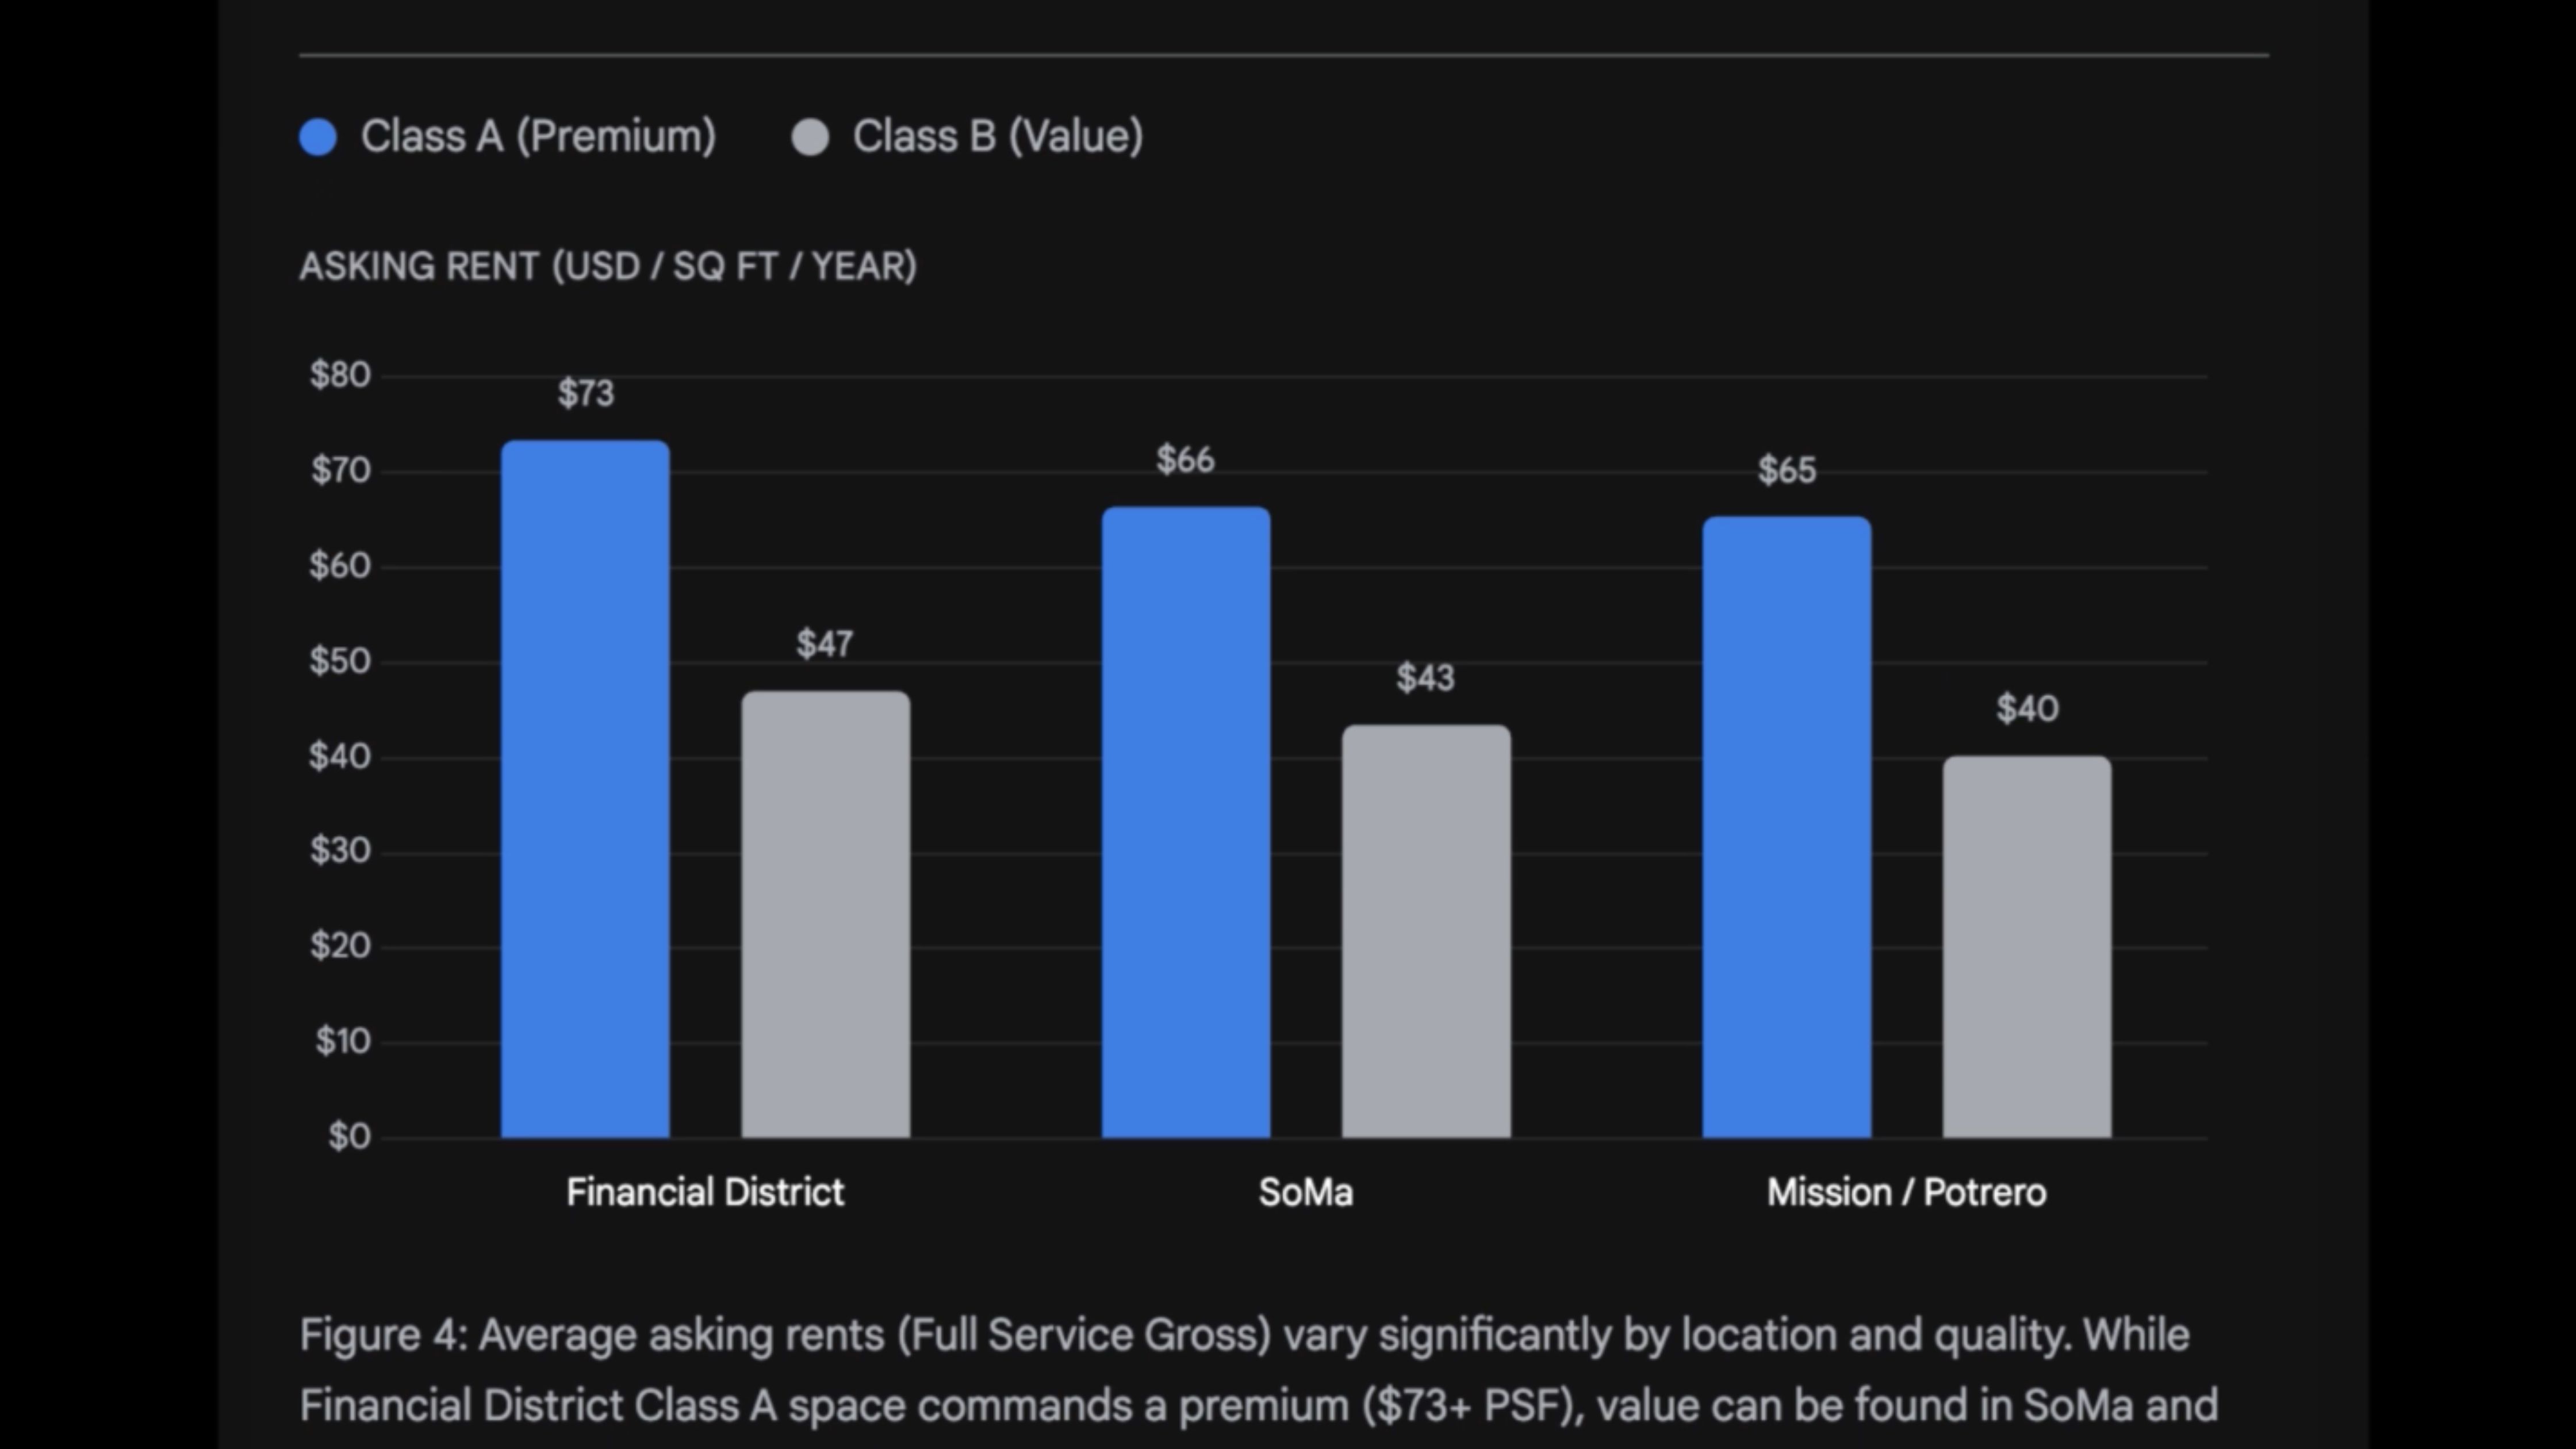
Gemini can intelligently decide which graphics and visuals to create based on the findings of a Deep Research report. For example, it might build an interactive periodic table of the elements if your report is about chemistry. Data-dense reports might be used to display a line or bar graph. The visuals are dynamically created in real time so they're specific to your Deep Research prompt.
Beyond basic visuals, Gemini's Deep Research can now make diagrams and schematics.
Users can try out Deep Research in the Gemini app starting now on the web. You can access it by selecting Deep Research from the Tools menu in the Gemini prompt box. From there, enter a Deep Research request, and wait for Gemini to build a custom research report that now includes AI-generated graphics.
Like generative UIs in AI Mode in Search, Deep Research's enhanced reports with interactive visuals are exclusive to Google AI Ultra subscribers — at least for now. It's a pricey subscription plan that costs $250 per month at full price. Hopefully, the expanded Deep Research capabilities will make their way to more Gemini users in the future.