
GameStop Corp. (NYSE:GME) was spiking up more than 8% on Tuesday, in tandem with the S&P 500, which gapped up and continued to surge about 2.8% intraday.
The gaming retailer looked set to bounce regardless of the bullish price action in the general market because GameStop formed a triple bottom pattern on the daily chart.
A double bottom pattern is a reversal indicator that shows a stock has dropped to a key support level, rebounded, back-tested the level as support and is likely to rebound again. It is possible the stock may retest the level as support again creating a triple bottom or even quadruple bottom pattern.
The formation is always identified after a security has dropped in price and is at the bottom of a downtrend whereas a bearish double top pattern is always found in an uptrend. A spike in volume confirms the double bottom pattern was recognized and subsequent increasing volume may indicate the stock will reverse into an uptrend.
- Aggressive bullish traders may choose to take a position when the stock’s volume spikes after the second retest of the support level. Conservative bullish traders may wait to take a position when the stock’s share price has surpassed the level of the initial rebound (the high before the second bounce from the support level).
- Bearish traders may choose to open a short position if the stock rejects at the level of the first rebound or if the stock falls beneath the key support level it created the double bottom pattern at.
Want direct analysis? Find me in the BZ Pro lounge! Click here for a free trial
The GameStop Chart: GameStop formed a triple bottom pattern near the $24 level on Sept. 23, Sept. 26 and Oct. 3. On Monday, the stock began to react to the pattern, rising up off the low-of-day to print a bullish hammer candlestick on the daily chart, which indicated the stock was likely to trade higher on Tuesday.
- On Tuesday, GameStop gapped up slightly higher and surged intraday. If the stock closes the trading session near its high-of-day price, GameStop will print a bullish kicker candlestick pattern on the daily chart, which could indicate higher prices will come again on Wednesday.
- If higher prices aren’t in the cards, the second most likely scenario is the stock will trade sideways to consolidate in an inside bar pattern. If the stock runs into sellers and closes the trading session with an upper wick, it could indicate lower prices are on the horizon.
- On Monday, GameStop printed a higher low, which negated the downtrend the stock had been trading in since Aug. 8. In order for a new uptrend to confirm, GameStop will have to rise up to print a higher high above the most recent lower high, which was formed on Sept. 28 at $27.69.
- GameStop has resistance above at $28.34 and $32.29 and support below at $24.03 and $19.44.
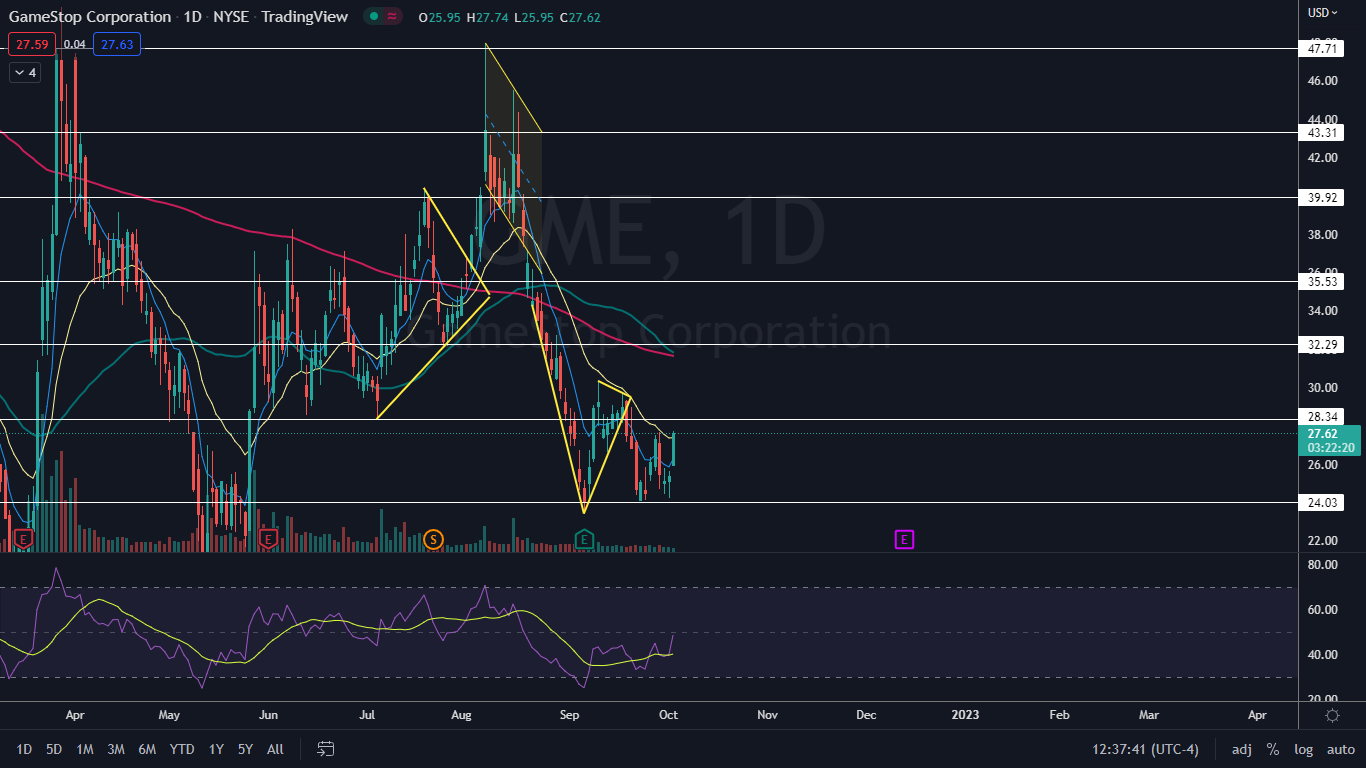
Photo: Shutterstock