GameStop Corporation (NYSE:GME) was surging over 6% at one point on Tuesday as the stock continued trending higher in the uptrend that Benzinga called out on July 14.
On July 15, GameStop printed its next higher low within the pattern, which gave bullish traders who weren’t already in a position a solid entry point. A trader who recognized the higher low, when GameStop printed a hammer candlestick on that day, would be up about 10% from the July 15 closing price.
GameStop’s NFT marketplace went live last week, and during its first two days the sales volume surpassed Coinbase Global, Inc’s (NASDAQ:COIN) total sales volume since the latter launched it marketplace to the public in May.
The popularity of GameStop’s NFT marketplace is likely due to the video game retailer’s faithfully vocal following of retail traders.
On Friday, GameStop will begin trading on a 4-1 split adjusted basis, making its shares more affordable for retail traders. If GameStop closes Thursday’s trading session near about the $150 mark, its shares will open Friday’s session at a price of about $37.50.
GameStop may run higher than $150 over the next few days. A lower high is also likely to print, since GameStop confirmed on Tuesday that its uptrend is intact.
Want direct analysis? Find me in the BZ Pro lounge! Click here for a free trial.
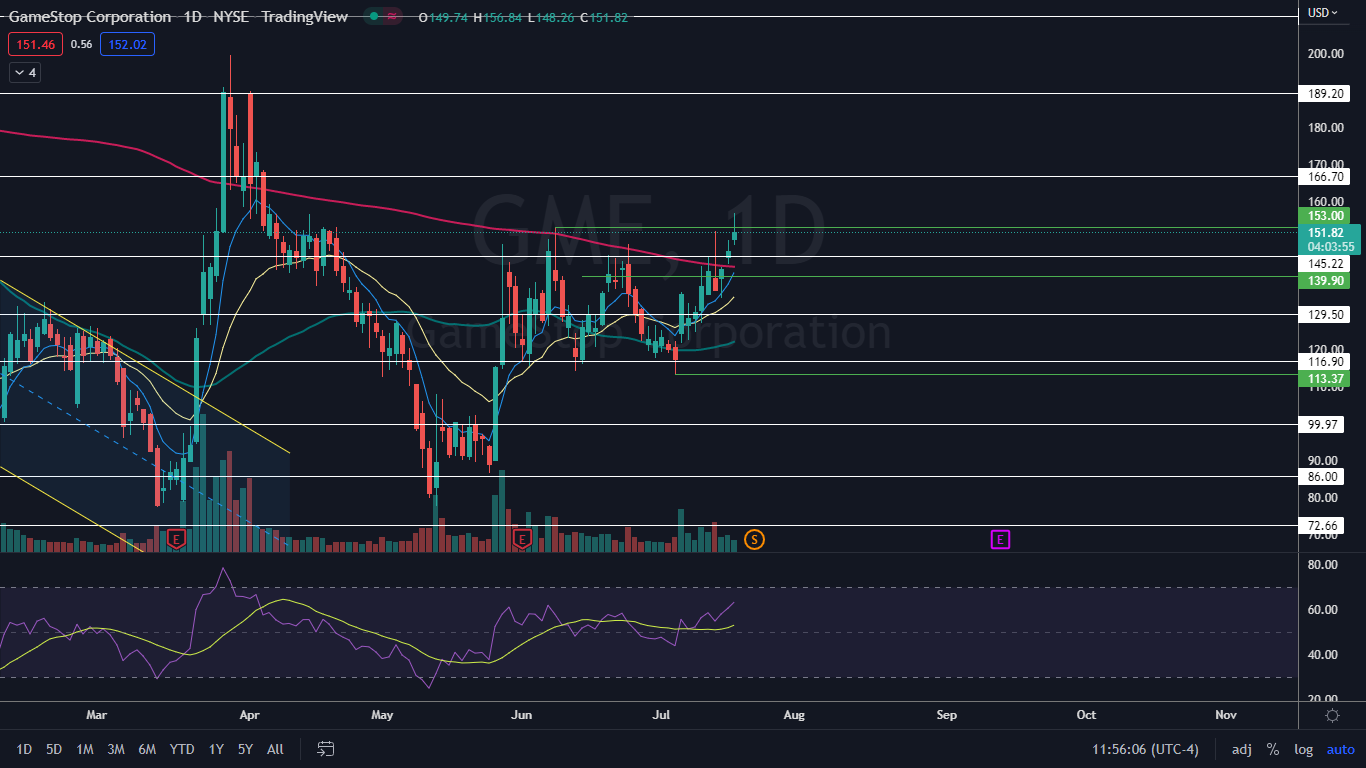
The GameStop Chart: When GameStop reached its high-of-day on Tuesday, it ran into a group of sellers who pushed the stock back down under the breakout level of $153. If GameStop closes the trading session under that level, the stock will print a shooting star candlestick, which could indicate a retracement to form another higher low is in the cards.
If bulls continue to pile into GameStop on Tuesday and the stock closes near its high-of-day price, GameStop will print a bullish Marubozu candlestick, which could indicate higher prices will come again on Wednesday.
- GameStop’s most recent confirmed higher high within its uptrend was formed at the $151.95 mark on July 14 and the most recent higher low was printed the following day at $134.03. Bullish traders who aren’t already in a position can watch for GameStop to print a reversal candlestick, such as a doji or hammer candlestick, above the $134 level for a possible solid entry point.
- Bullish traders would like to see GameStop making a larger pullback over the next few days before trekking higher because the stock’s relative strength index (RSI) is trending toward overbought territory.
- When a stock’s RSI nears or reaches the 70% level, it can be a sign a pullback is on the horizon, and GameStop’s RSI is measuring in at about 64%.
- GameStop has resistance above at $166.70 and $189.20 and support below at $145.22 and $129.50.